Assembly District 28
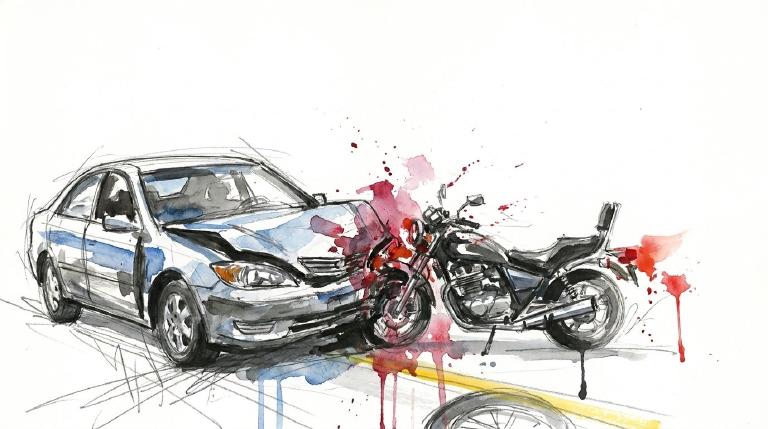
Crash Narratives
Assembly District 28: Traffic Crash Statistics
Crash Counter for AD 28 445 crashes • 1 deaths
About these crash totals
Counts come from NYC police crash reports (NYPD Motor Vehicle Collisions on NYC Open Data). We sum all crashes, injuries, and deaths for this area across the selected time window shown on the card. Injury severity follows DOT's KABCO definitions mapped from the NYPD Person table (injury status, injury type, and injury location).
- Crashes: number of police‑reported collisions (all road users).
- All injuries: people with any reported injury (KABCO A/B/C or generic "injured").
- Moderate / Serious: suspected minor + suspected serious injuries (KABCO B + A).
- Deaths: killed or apparent death reported by police (KABCO K).
Change badges (arrows and percentages) compare the selected window with the same period last year whenever we have enough history. The “From 2022” view shows totals across the full span since 2022. When a comparison window isn’t available the badge shows an em dash.
Notes: Police reports can be corrected after initial publication. We cannot verify "death within 30 days" or hospital outcomes, so small differences from DOT totals are possible. Minor incidents without a police report are not included.
CloseCaught Speeding in AD 28 KXM7078 — 247 times
- 247 speed-camera tickets citywide in 12 monthsNY KXM7078 · 2022 Gray Ford PickupCaught here 9 times in the last 12 months.Typically speeds citywide in: East New York-New Lots (23), Crown Heights (North) (19), and Concourse-Concourse Village (15).
- 193 speed-camera tickets citywide in 12 monthsGA RUN1724 · 2020 Black BMW MpCaught here 1 time in the last 12 months.Typically speeds citywide in: Crown Heights (North) (82), Prospect Heights (15), and Spring Creek-Starrett City (13).
- 190 speed-camera tickets citywide in 12 monthsNC 7M6148 · 2020 Black Harle MotorcycleCaught here 10 times in the last 12 months.Typically speeds citywide in: Ozone Park (61), Howard Beach-Lindenwood (52), and Breezy Point-Belle Harbor-Rockaway Park-Broad Channel (35).
- 184 speed-camera tickets citywide in 12 monthsGA SGY7043 · 2021 White Mercedes-Benz 4SCaught here 3 times in the last 12 months.Typically speeds citywide in: Canarsie (50), Sheepshead Bay-Manhattan Beach-Gerritsen Beach (19), and Baisley Park (16).
- 182 speed-camera tickets citywide in 12 monthsNY KZF9054 · 2023 Black Mitsubishi SuburbanCaught here 6 times in the last 12 months.Typically speeds citywide in: East New York-New Lots (12), Crown Heights (North) (10), and Bedford Park (9).
About this list
This ranks vehicles caught speeding in this area during the latest 12-month window by the number of NYC school-zone speed-camera violations they received anywhere in the city during that same window.
Camera violations are issued by NYC DOT’s program. Counts reflect issued tickets and may omit dismissed or pending cases. Plate text is shown verbatim as recorded.
CloseDangerous Schools in AD 28 Loading school hotspots...
| School | Crashes
Injuries
Child injuries
Deaths |
|---|
Dangerous Streets in AD 28 Loading street hotspots...
| Street | Crashes
Injuries
Child injuries
Deaths |
|---|
Dangerous Intersections in AD 28 Loading intersection hotspots...
| Intersection | Crashes
Injuries
Child injuries
Deaths |
|---|
Crash Finder
Try Crash Finder
Look up any street, school, address, or intersection to see how safe the streets are.
AD 28 Hot Spots Danger zones and recent crashes
Traffic Safety Timeline Tap to view recent events
Carnage in AD 28 6 Contusion/Bruise (Lower leg/foot)
▸ Killed 1
▸ Crush Injuries 3
▸ Concussion 1
▸ Fracture/Dislocation 3
▸ Internal Injury 3
▸ Whiplash 12
▸ Contusion/Bruise 17
▸ Abrasion 4
▸ Pain/Nausea 1
Crashes by Hour in AD 28 2 PM • 20 injuries ↑11%
Who is getting hurt? Kids 12 injuries ↓48% Seniors 24 injuries ↑26%
Toggle on at least one mode to see people totals.
Totals count people injured or killed. Use the mode filters above to focus the stacks.
Dangerous Bike Lanes in AD 28 Loading bike lane hotspots...
| Bike lane | Crashes
Cyclist injuries
Child injuries
Cyclist deaths |
|---|
What Crashes Cost Here Loading estimate...
Loading crash cost estimate...
The three blocks below show direct costs, other harm, and the total for crashes with injuries, crashes without injuries, and all crashes together.
How we calculate this
We calculate these costs using a method developed by the National Highway Traffic Safety Administration, or NHTSA. It gives one set of costs for crashes with injuries and another for crashes with no reported injuries.
Crashes with injuries cost much more because the method includes things like lost work, medical care, and long-term harm. NHTSA says crash costs include "lost productivity, medical, legal and court costs, emergency service, insurance administration, congestion, property damage, and workplace losses."
These are estimates, not bills. "Other harm" is the part of the broader estimate that goes beyond direct bills and insurance claims. It captures pain, disability, and lost quality of life.
Download the math (CSV) · Download the math (JSON) · Method and sources
Preventable Speeding 3,128 16+ offenders ↓70%
Repeat School-Zone Speeding Offenders
- ≥ 6: 7,647 (2026 year-to-date) • Prev: 24,152 2025 year-to-date
- ≥ 16: 3,128 (2026 year-to-date) • Prev: 10,595 2025 year-to-date
Pedestrian Injuries 96% by Cars and Trucks ↑18%
About this chart
We group pedestrian injuries and deaths by the vehicle type that struck them (as recorded in police reports). Use the year selector to compare the current window with the prior period.
- Trucks/Buses, SUVs/Cars, Mopeds, and Bikes reflect the broad categories we use to track vehicle harm.
- Counts include people on foot only; crashes with no injured pedestrians do not appear in this card.
Notes: Police classification can change during investigations. Small categories may have year-to-year variance.
CloseAssembly Member Andrew Hevesi F (50)*
District 28
- 2022-06-02 · Vote · Open States · ↑ helps gradeSenate passed S 5602 to keep school zone speed cameras running longer. More eyes on reckless drivers. Lawmakers push back against speeding near kids. The vote was clear. The danger remains.
- 2022-05-31 · Vote · Open States · ↓ hurts gradeAssembly and Senate passed A 8933. The bill shields emergency vehicle operators from fines for traffic violations during medical calls. Vulnerable road users face more risk. Accountability weakens. Streets grow more dangerous.
- 2022-05-31 · Vote · Open States · ↓ hurts gradeAssembly and Senate passed A 8933. The bill shields emergency vehicle operators from fines for traffic violations during medical calls. Vulnerable road users face more risk. Accountability weakens. Streets grow more dangerous.
- 2022-05-25 · Vote · Open States · ↑ helps gradeSenate passed S 5602 to keep school zone speed cameras running longer. More eyes on reckless drivers. Lawmakers push back against speeding near kids. The vote was clear. The danger remains.
- 2022-05-31 · Vote · Open States · ↓ hurts gradeAssembly and Senate passed A 8933. The bill shields emergency vehicle operators from fines for traffic violations during medical calls. Vulnerable road users face more risk. Accountability weakens. Streets grow more dangerous.
- 2022-05-31 · Vote · Open States · ↓ hurts gradeAssembly and Senate passed A 8933. The bill shields emergency vehicle operators from fines for traffic violations during medical calls. Vulnerable road users face more risk. Accountability weakens. Streets grow more dangerous.
- 2022-05-25 · Vote · Open States · ↑ helps gradeSenate passed S 5602 to keep school zone speed cameras running longer. More eyes on reckless drivers. Lawmakers push back against speeding near kids. The vote was clear. The danger remains.
- 2022-05-23 · Vote · Open States · ↑ helps gradeSenate and Assembly passed S 1078. New drivers must now learn how to avoid hitting people on foot or bike. Law aims to cut crashes at the root—before drivers get the keys.
- 2023-08-18 · Sponsor · Open States · ↑ helps gradeAssembly bill A 7979 targets reckless drivers. Eleven points or six camera tickets triggers a speed limiter. Lawmakers move to curb repeat danger. No more unchecked speeding. Streets demand it.
- 2023-06-06 · Vote · Open States · ↑ helps gradeAlbany gets speed cameras near schools. Lawmakers pass A 7043. Cameras catch drivers who endanger kids. The program runs until 2028. Streets near schools face new watchful eyes.
- 2023-06-06 · Vote · Open States · ↑ helps gradeAlbany gets speed cameras near schools. Lawmakers pass A 7043. Cameras catch drivers who endanger kids. The program runs until 2028. Streets near schools face new watchful eyes.
- 2023-06-06 · Vote · Open States · ↑ helps gradeHevesi votes yes to require recall checks before used car sales.
- 2023-02-13 · Vote · Open States · ↑ helps gradeAssembly and Senate passed A 602. The bill sets state funding rules for federally assisted and municipal complete street projects. Lawmakers moved fast. Streets shaped by budgets, not safety.
- 2023-02-10 · Sponsor · Open States · ↑ helps gradeHevesi co-sponsors bill on ignition interlock monitor responsibilities, no safety impact.
- 2023-01-24 · Vote · Open States · ↑ helps gradeAssembly and Senate passed A 602. The bill sets state funding rules for federally assisted and municipal complete street projects. Lawmakers moved fast. Streets shaped by budgets, not safety.
- 2023-01-13 · Sponsor · Open States · ↑ helps gradeAssembly bill A 1280 pushes for streets built for all. Dozens of lawmakers back the plan. The bill demands roads that protect walkers, cyclists, and riders. It calls for design, not luck, to keep people safe.
- 2024-08-23 · Leadership · Streetsblog NYC · ↑ helps gradeLawmakers say Hochul broke the law. They filed a brief. They argue the governor has no right to halt congestion pricing. The MTA Board, not Albany, holds the power. The pause sows confusion. Streets stay clogged. Vulnerable New Yorkers pay the price.
- 2024-06-07 · Vote · Open States · ↑ helps gradeAssembly passes A 7652. Schenectady gets school speed cameras. Law aims to slow drivers near kids. Cameras expire in 2028. Vote split. Streets may get safer for children on foot.
- 2024-06-07 · Vote · Open States · ↑ helps gradeAssembly passes A 7652. Schenectady gets school speed cameras. Law aims to slow drivers near kids. Cameras expire in 2028. Vote split. Streets may get safer for children on foot.
- 2024-06-07 · Vote · Open States · ↑ helps gradeLawmakers back speed cameras near Kingston schools. Cameras catch drivers who speed. The bill passed both chambers. It sunsets in 2029. Children and families walk safer, but the fix is temporary.
- 2024-04-18 · Vote · Open States · ↑ helps gradeHevesi votes yes on transportation budget bill with no safety impact.
- 2024-04-18 · Vote · Open States · ↑ helps gradeHevesi votes yes on transportation budget bill with no safety impact.
- 2024-04-02 · Vote · Open States · ↑ helps gradeHevesi votes yes to require recall checks before used car sales.
- 2025-06-17 · Vote · Open States · ↑ helps gradeSenate passes S 8344. School speed zone rules in New York City get extended. Lawmakers make technical fixes. The bill keeps pressure on drivers near schools. Streets stay a little safer for kids.
- 2025-06-16 · Vote · Open States · ↓ hurts gradeSenate passed S 7785. The bill carves out large Mitchell-Lama housing from bus traffic rules. Lawmakers voted yes. The carve-out weakens enforcement. Streets grow less safe for people on foot and bike.
- 2025-06-16 · Vote · Open States · ↑ helps gradeWhite Plains gets speed cameras near schools. Lawmakers move fast. Most vote yes. Cameras catch drivers who endanger kids. Program ends 2030. Streets may slow. Danger faces children every day.
- 2025-06-13 · Vote · Open StatesSenate and Assembly clear S 6815. MTA workers get a pass for driving in bus lanes while on duty. Law shields agency vehicles from tickets. Streets grow more crowded. Vulnerable users face more risk.
- 2025-05-07 · Vote · Open States · ↑ helps gradeHevesi votes yes on transportation budget bill with no safety impact.
- 2025-05-07 · Vote · Open States · ↑ helps gradeHevesi votes yes on transportation budget bill with no safety impact.
- 2025-02-10 · Sponsor · Open States · ↓ hurts gradeHevesi co-sponsors bill on autonomous vehicles, no safety impact expected.
- 2025-01-16 · Sponsor · Open States · ↑ helps gradeAssembly bill A 2299 targets reckless drivers. Eleven points or six camera tickets in a year triggers forced speed control tech. Lawmakers move to curb repeat speeders. Streets demand fewer deadly risks.
- 2026-01-30 · Sponsor · Open StatesHevesi co-sponsors climate and community investment act, with no safety impact.
- 2026-01-30 · Sponsor · Open StatesHevesi co-sponsors climate and community investment act, with no safety impact.
- 2025-06-17 · Vote · Open States · ↑ helps gradeSenate passes S 8344. School speed zone rules in New York City get extended. Lawmakers make technical fixes. The bill keeps pressure on drivers near schools. Streets stay a little safer for kids.
- 2025-06-16 · Vote · Open States · ↓ hurts gradeSenate passed S 7785. The bill carves out large Mitchell-Lama housing from bus traffic rules. Lawmakers voted yes. The carve-out weakens enforcement. Streets grow less safe for people on foot and bike.
- 2025-06-16 · Vote · Open States · ↑ helps gradeWhite Plains gets speed cameras near schools. Lawmakers move fast. Most vote yes. Cameras catch drivers who endanger kids. Program ends 2030. Streets may slow. Danger faces children every day.
70-50 Austin St. Suite 114, Forest Hills, NY 11375
718-263-5595
Room 626, Legislative Office Building, Albany, NY 12248
518-455-4926
Council Member Phil Wong D (52)

District 30
- 2026-04-30 · Sponsor · NYC Council – Legistar · ↓ hurts gradeA new Council bill would bar many commercial vehicles from sitting overnight on residential blocks. It aims at 9 p.m. to 5 a.m. parking that can clog curbs and narrow sightlines.
- 2026-04-30 · Sponsor · NYC Council – LegistarInt 0889-2026 would bar certain utility and heating trucks from overnight curb space. It would end 9 p.m.–5 a.m. parking on residential streets, with a narrow defense tied to active work nearby.
- 2026-04-30 · Sponsor · NYC Council – LegistarInt 0889-2026 would bar overnight commercial parking on residential blocks. The ban runs 9 p.m. to 5 a.m. It includes utility and heating-company trucks. The bill now sits in committee.
- 2026-04-30 · Sponsor · NYC Council – LegistarWong co-sponsors reclaimed asphalt pavement pilot program study bill.
58-38 69th Street, Maspeth, NY 11378
718-366-3900
250 Broadway, Suite 1781, New York, NY 10007
212-788-7381
Other Geographies See nearby areas
▸ Other Geographies
AD 28 Assembly District 28 sits in Queens, District 30, Precinct 112.
It contains Queens CB 5, Queens CB 6, Queens CB 82, Glendale, Middle Village, Mount Olivet & All Faiths Cemeteries, Middle Village Cemetery, St. John Cemetery, Rego Park, Forest Hills, Kew Gardens, Forest Park.
▸ See also
