Assembly District 38
Crash Narratives
Assembly District 38: Traffic Crash Statistics
Crash Counter for AD 38 395 crashes • 2 deaths
About these crash totals
Counts come from NYC police crash reports (NYPD Motor Vehicle Collisions on NYC Open Data). We sum all crashes, injuries, and deaths for this area across the selected time window shown on the card. Injury severity follows DOT's KABCO definitions mapped from the NYPD Person table (injury status, injury type, and injury location).
- Crashes: number of police‑reported collisions (all road users).
- All injuries: people with any reported injury (KABCO A/B/C or generic "injured").
- Moderate / Serious: suspected minor + suspected serious injuries (KABCO B + A).
- Deaths: killed or apparent death reported by police (KABCO K).
Change badges (arrows and percentages) compare the selected window with the same period last year whenever we have enough history. The “From 2022” view shows totals across the full span since 2022. When a comparison window isn’t available the badge shows an em dash.
Notes: Police reports can be corrected after initial publication. We cannot verify "death within 30 days" or hospital outcomes, so small differences from DOT totals are possible. Minor incidents without a police report are not included.
CloseCaught Speeding in AD 38 KXM7078 — 247 times
- 247 speed-camera tickets citywide in 12 monthsNY KXM7078 · 2022 Gray Ford PickupCaught here 1 time in the last 12 months.Typically speeds citywide in: East New York-New Lots (23), Crown Heights (North) (19), and Concourse-Concourse Village (15).
- 194 speed-camera tickets citywide in 12 monthsPA MGT2007 · 2004 Gray Lincoln SedanCaught here 1 time in the last 12 months.Typically speeds citywide in: Jamaica (98), Hollis (71), and Queens Village (8).
- 190 speed-camera tickets citywide in 12 monthsNC 7M6148 · 2020 Black Harle MotorcycleCaught here 22 times in the last 12 months.Typically speeds citywide in: Ozone Park (61), Howard Beach-Lindenwood (52), and Breezy Point-Belle Harbor-Rockaway Park-Broad Channel (35).
- 184 speed-camera tickets citywide in 12 monthsGA SGY7043 · 2021 White Mercedes-Benz 4SCaught here 1 time in the last 12 months.Typically speeds citywide in: Canarsie (50), Sheepshead Bay-Manhattan Beach-Gerritsen Beach (19), and Baisley Park (16).
- 182 speed-camera tickets citywide in 12 monthsNY KZF9054 · 2023 Black Mitsubishi SuburbanCaught here 10 times in the last 12 months.Typically speeds citywide in: East New York-New Lots (12), Crown Heights (North) (10), and Bedford Park (9).
About this list
This ranks vehicles caught speeding in this area during the latest 12-month window by the number of NYC school-zone speed-camera violations they received anywhere in the city during that same window.
Camera violations are issued by NYC DOT’s program. Counts reflect issued tickets and may omit dismissed or pending cases. Plate text is shown verbatim as recorded.
CloseDangerous Schools in AD 38 Loading school hotspots...
| School | Crashes
Injuries
Child injuries
Deaths |
|---|
Dangerous Streets in AD 38 Loading street hotspots...
| Street | Crashes
Injuries
Child injuries
Deaths |
|---|
Dangerous Intersections in AD 38 Loading intersection hotspots...
| Intersection | Crashes
Injuries
Child injuries
Deaths |
|---|
Crash Finder
Try Crash Finder
Look up any street, school, address, or intersection to see how safe the streets are.
AD 38 Hot Spots Danger zones and recent crashes
Traffic Safety Timeline Tap to view recent events
Carnage in AD 38 5 Minor Bleeding (Lower leg/foot)
▸ Killed 2
▸ Severe Lacerations 3
▸ Concussion 1
▸ Fracture/Dislocation 4
▸ Internal Injury 6
▸ Whiplash 8
▸ Contusion/Bruise 10
▸ Abrasion 1
▸ Pain/Nausea 4
Crashes by Hour in AD 38 5 PM • 16 injuries ↑6.7%
Who is getting hurt? Kids 22 injuries ↓8.3% Seniors 15 injuries ↑7.1%
Toggle on at least one mode to see people totals.
Totals count people injured or killed. Use the mode filters above to focus the stacks.
Dangerous Bike Lanes in AD 38 Loading bike lane hotspots...
| Bike lane | Crashes
Cyclist injuries
Child injuries
Cyclist deaths |
|---|
What Crashes Cost Here Loading estimate...
Loading crash cost estimate...
The three blocks below show direct costs, other harm, and the total for crashes with injuries, crashes without injuries, and all crashes together.
How we calculate this
We calculate these costs using a method developed by the National Highway Traffic Safety Administration, or NHTSA. It gives one set of costs for crashes with injuries and another for crashes with no reported injuries.
Crashes with injuries cost much more because the method includes things like lost work, medical care, and long-term harm. NHTSA says crash costs include "lost productivity, medical, legal and court costs, emergency service, insurance administration, congestion, property damage, and workplace losses."
These are estimates, not bills. "Other harm" is the part of the broader estimate that goes beyond direct bills and insurance claims. It captures pain, disability, and lost quality of life.
Download the math (CSV) · Download the math (JSON) · Method and sources
Preventable Speeding 753 16+ offenders ↓72%
Repeat School-Zone Speeding Offenders
- ≥ 6: 1,705 (2026 year-to-date) • Prev: 5,785 2025 year-to-date
- ≥ 16: 753 (2026 year-to-date) • Prev: 2,692 2025 year-to-date
Pedestrian Injuries 98% by Cars and Trucks ↓8.5%
About this chart
We group pedestrian injuries and deaths by the vehicle type that struck them (as recorded in police reports). Use the year selector to compare the current window with the prior period.
- Trucks/Buses, SUVs/Cars, Mopeds, and Bikes reflect the broad categories we use to track vehicle harm.
- Counts include people on foot only; crashes with no injured pedestrians do not appear in this card.
Notes: Police classification can change during investigations. Small categories may have year-to-year variance.
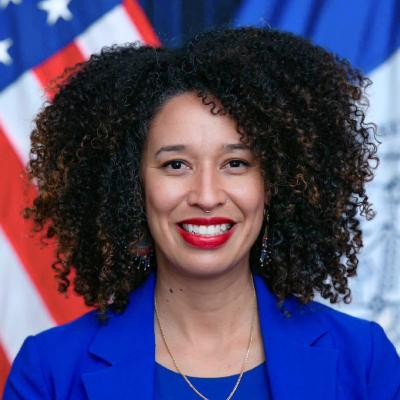
CloseAssembly Member Jenifer Rajkumar F (55)*

District 38
- 2022-09-16 · Leadership · Streetsblog NYC · ↑ helps gradeMayor Adams broke ground on QueensWay, a $35 million park project on old rail tracks. Supporters cheer new green space for 330,000 locals. Critics warn it kills hopes for restored train service. The fight pits open space against transit justice in Queens.
- 2022-06-02 · Vote · Open States · ↑ helps gradeSenate passed S 5602 to keep school zone speed cameras running longer. More eyes on reckless drivers. Lawmakers push back against speeding near kids. The vote was clear. The danger remains.
- 2022-05-31 · Vote · Open States · ↓ hurts gradeAssembly and Senate passed A 8933. The bill shields emergency vehicle operators from fines for traffic violations during medical calls. Vulnerable road users face more risk. Accountability weakens. Streets grow more dangerous.
- 2022-05-31 · Vote · Open States · ↓ hurts gradeAssembly and Senate passed A 8933. The bill shields emergency vehicle operators from fines for traffic violations during medical calls. Vulnerable road users face more risk. Accountability weakens. Streets grow more dangerous.
- 2022-05-31 · Vote · Open States · ↓ hurts gradeAssembly and Senate passed A 8933. The bill shields emergency vehicle operators from fines for traffic violations during medical calls. Vulnerable road users face more risk. Accountability weakens. Streets grow more dangerous.
- 2022-05-31 · Vote · Open States · ↓ hurts gradeAssembly and Senate passed A 8933. The bill shields emergency vehicle operators from fines for traffic violations during medical calls. Vulnerable road users face more risk. Accountability weakens. Streets grow more dangerous.
- 2022-05-25 · Vote · Open States · ↑ helps gradeSenate passed S 5602 to keep school zone speed cameras running longer. More eyes on reckless drivers. Lawmakers push back against speeding near kids. The vote was clear. The danger remains.
- 2022-05-23 · Vote · Open States · ↑ helps gradeSenate and Assembly passed S 1078. New drivers must now learn how to avoid hitting people on foot or bike. Law aims to cut crashes at the root—before drivers get the keys.
- 2023-06-06 · Vote · Open States · ↑ helps gradeAlbany gets speed cameras near schools. Lawmakers pass A 7043. Cameras catch drivers who endanger kids. The program runs until 2028. Streets near schools face new watchful eyes.
- 2023-06-06 · Vote · Open States · ↑ helps gradeAlbany gets speed cameras near schools. Lawmakers pass A 7043. Cameras catch drivers who endanger kids. The program runs until 2028. Streets near schools face new watchful eyes.
- 2023-06-06 · Vote · Open States · ↑ helps gradeRajkumar votes yes to require recall checks before used car sales.
- 2023-06-06 · Vote · Open States · ↑ helps gradeRajkumar votes yes to require recall checks before used car sales.
- 2023-05-30 · Leadership · nypost.com · ↑ helps gradeNYC leaders went to Albany. They demanded lawmakers pass Sammy’s Law. The bill lets the city set its own speed limits. Brad Hoylman-Sigal led the charge. The law is named for a child killed by a car. The fight is urgent. Lives hang in the balance.
- 2023-02-13 · Vote · Open States · ↑ helps gradeAssembly and Senate passed A 602. The bill sets state funding rules for federally assisted and municipal complete street projects. Lawmakers moved fast. Streets shaped by budgets, not safety.
- 2023-01-24 · Vote · Open States · ↑ helps gradeAssembly and Senate passed A 602. The bill sets state funding rules for federally assisted and municipal complete street projects. Lawmakers moved fast. Streets shaped by budgets, not safety.
- 2023-01-13 · Sponsor · Open States · ↑ helps gradeAssembly bill A 1280 pushes for streets built for all. Dozens of lawmakers back the plan. The bill demands roads that protect walkers, cyclists, and riders. It calls for design, not luck, to keep people safe.
- 2024-06-07 · Vote · Open States · ↑ helps gradeAssembly passes A 7652. Schenectady gets school speed cameras. Law aims to slow drivers near kids. Cameras expire in 2028. Vote split. Streets may get safer for children on foot.
- 2024-06-07 · Vote · Open States · ↑ helps gradeAssembly passes A 7652. Schenectady gets school speed cameras. Law aims to slow drivers near kids. Cameras expire in 2028. Vote split. Streets may get safer for children on foot.
- 2024-06-07 · Vote · Open States · ↑ helps gradeLawmakers back speed cameras near Kingston schools. Cameras catch drivers who speed. The bill passed both chambers. It sunsets in 2029. Children and families walk safer, but the fix is temporary.
- 2024-06-06 · Vote · Open States · ↑ helps gradeLawmakers back speed cameras near Kingston schools. Cameras catch drivers who speed. The bill passed both chambers. It sunsets in 2029. Children and families walk safer, but the fix is temporary.
- 2024-04-18 · Vote · Open States · ↑ helps gradeRajkumar votes yes on transportation budget bill with no safety impact.
- 2024-04-18 · Vote · Open States · ↑ helps gradeRajkumar votes yes on transportation budget bill with no safety impact.
- 2024-04-11 · Leadership · Streetsblog NYC · ↓ hurts gradeAssembly Member Rajkumar pushes harsh e-bike rules. Her own car racks up 10 school-zone speeding tickets. She calls e-bikes a menace, but city data shows cars injure far more. Vulnerable road users face danger from both policy and reckless driving.
- 2024-04-02 · Leadership · Streetsblog NYC · ↓ hurts gradeMayor Adams dodged questions on e-bike registration and battery swap rollout. City Hall offered no answers. Delivery workers wait. Council Member Powers grows impatient. Advocates warn registration could hurt cycling. The city stalls. Streets stay dangerous for riders and walkers.
- 2025-06-25 · Leadership · Streetsblog NYC · ↑ helps gradeVoters chose candidates who back bike lanes, open streets, and transit. Opponents lost. The message is clear: New Yorkers want safer roads. No new laws yet, but the council’s direction is set. Vulnerable road users watch and wait.
- 2025-06-17 · Vote · Open States · ↑ helps gradeSenate passes S 8344. School speed zone rules in New York City get extended. Lawmakers make technical fixes. The bill keeps pressure on drivers near schools. Streets stay a little safer for kids.
- 👎 Negative2025-06-16 · Vote · Open States · ↓ hurts gradeSenate passed S 7785. The bill carves out large Mitchell-Lama housing from bus traffic rules. Lawmakers voted yes. The carve-out weakens enforcement. Streets grow less safe for people on foot and bike.
- 2025-06-16 · Vote · Open States · ↓ hurts gradeWhite Plains gets speed cameras near schools. Lawmakers move fast. Most vote yes. Cameras catch drivers who endanger kids. Program ends 2030. Streets may slow. Danger faces children every day.
- 2025-05-09 · Leadership · Streetsblog NYC · ↓ hurts gradeLawmakers stripped Hochul’s safety plans from the state budget. No daylighting near schools. No lower bike lane speed limits. No new e-bike rules. City and state leaders bickered. Streets stay dangerous. Pedestrians and cyclists remain exposed. The system failed them again.
- 2025-05-07 · Vote · Open States · ↑ helps gradeRajkumar votes yes on transportation budget bill with no safety impact.
- 2025-05-07 · Vote · Open States · ↑ helps gradeRajkumar votes yes on transportation budget bill with no safety impact.
- 2025-03-12 · Leadership · amny.com · ↓ hurts gradeDozens gathered in Midtown. They demanded e-bike registration and license plates. Priscilla’s Law, named for a pedestrian killed by an e-bike, drove the call. Council Member Holden and Assembly Member Rajkumar led. Advocates want accountability. They say e-bike chaos endangers walkers and cyclists.
- 2026-03-03 · Leadership · AMNY · ↑ helps gradeOn March 3, Jenifer Rajkumar rolled out “Revive Atlantic 2.0” for Atlantic Avenue. It calls for rebuilt sidewalks, traffic-calming, and a reopened Woodhaven LIRR stop. The pitch: more feet on the street, fewer hazards.
- 2026-01-30 · Sponsor · Open StatesRajkumar sponsors climate and community investment act bill as primary sponsor.
- 2026-01-22 · Leadership · Streetsblog Empire State · ↓ hurts gradeAlbany opened a hearing to treat e-bikes as a menace. Registration talk hung over the room. The risk: punish riders, chill cycling, and leave street danger untouched.
- 2025-06-25 · Leadership · Streetsblog NYC · ↑ helps gradeVoters chose candidates who back bike lanes, open streets, and transit. Opponents lost. The message is clear: New Yorkers want safer roads. No new laws yet, but the council’s direction is set. Vulnerable road users watch and wait.
83-91 Woodhaven Blvd., Woodhaven, NY 11421
718-805-0950
Room 637, Legislative Office Building, Albany, NY 12248
518-455-4621
Council Member Sandy Nurse A (100)*
District 37
- 2024-12-19 · Vote · NYC Council – Legistar · ↑ helps gradeNurse votes no on bill requiring FDNY input on street projects.
- 2024-12-05 · Sponsor · NYC Council – Legistar · ↑ helps gradeCouncil bill bars cars from blocking crosswalks. No standing or parking within 20 feet. City must install daylighting barriers at 1,000 intersections yearly. Streets clear. Sightlines open. Danger cut.
- 2024-11-13 · Sponsor · NYC Council – Legistar · ↑ helps gradeCouncil demands DOT show its work. The law forces public updates on every street safety project. No more hiding delays. No more silent cost overruns. Progress for bus riders, cyclists, and walkers must be tracked and posted.
- 2024-10-10 · Sponsor · NYC Council – Legistar · ↑ helps gradeCouncil bill orders DOT to build 35 e-bike battery stations yearly. A quarter will sit curbside, letting riders lock up. Sponsors: Rivera, Nurse, Hanif. Streets may shift. City must post locations.
- 2024-05-16 · Sponsor · NYC Council – Legistar · ↑ helps gradeCouncil moves to light up step streets. At least 25 stairways each year will get new lamps. Dark paths become visible. Pedestrians gain ground. Shadows shrink. Danger loses its cover.
- 2024-03-07 · Sponsor · NYC Council – Legistar · ↑ helps gradeCouncil bill demands DOT fix NYCHA sidewalks first. Seniors come before all. Broken walks trip, injure, kill. Law forces city to show its work. No more hiding behind red tape.
- 2024-02-28 · Sponsor · NYC Council – LegistarCouncil passed a law forcing taxis and for-hire cars to post bold warnings on doors. The signs tell passengers: look for cyclists before you open up. A small step. The city hands out the decals. No cost to drivers.
- 2024-02-28 · Sponsor · NYC Council – LegistarCouncil bill demands NYPD track every time cops use cars as weapons. No more hiding behind vague stats. Each crash, each injury, must be counted. The city moves closer to truth.
- 2025-07-30 · Leadership · City & State NY · ↑ helps gradeCouncil moves to ban parking near corners. Sightlines clear. Crashes drop. Pedestrians and cyclists breathe easier. DOT doubts linger. Advocates press on. Streets could change fast.
- 2025-07-17 · Leadership · AMNY · ↑ helps gradeCouncil raised pay for grocery deliveristas. EMTs now earn less. Delivery workers face city streets daily. Council chose their risk. First responders left behind.
- 2025-07-13 · Leadership · AMNY · ↑ helps gradeCouncil moves to shield delivery workers. Wage floors, tipping rules, and safety gear on the line. Workers face street danger daily. New rules aim to cut risk and boost dignity.
- 2025-06-30 · Vote · NYC Council – Legistar · ↑ helps gradeCouncil orders swift removal of abandoned, derelict cars. Streets clear in 72 hours. No plates, no stickers, no excuses. Police and sanitation must act. Safer crossings for all who walk, ride, or wait.
- 2025-05-28 · Sponsor · NYC Council – Legistar · ↑ helps gradeCouncil pushes a bill to cut bike share costs for New Yorkers over 65. The measure aims to open city cycling to more seniors. The committee now weighs its next move.
- 2025-05-28 · Sponsor · NYC Council – Legistar · ↑ helps gradeCouncil bill pushes for discounted bike share rates for New Yorkers 65 and up. The move aims to open city streets to older riders. The measure sits with the Transportation Committee. No safety review yet.
- 2025-05-28 · Sponsor · NYC Council – Legistar · ↑ helps gradeCouncil pushes bill for cheaper bike share for New Yorkers over 65. More seniors could ride. The city’s streets may see older cyclists in the mix. The committee now holds the bill.
- 2025-05-28 · Sponsor · NYC Council – Legistar · ↑ helps gradeCouncil pushes cheaper bike share for seniors. More elders could ride. Streets may see more slow, unprotected cyclists. Danger from cars remains. Bill sits in committee. No safety fixes for traffic threats.
- 2026-05-07 · Leadership · BKReader · ↑ helps gradeDOT says it will spend $1.85M to rebuild Broadway from Flushing Ave to Eastern Pkwy. The plan pairs new asphalt with curb extensions, sidewalk repairs, and some raised crosswalks.
- 2026-04-30 · Sponsor · NYC Council – LegistarNurse primarily sponsors bill banning NYPD weaponized robots, with no safety impact.
- 2026-03-10 · Sponsor · NYC Council – Legistar · ↑ helps gradeInt 0780-2026 targets NYPD speeding and crash secrecy. It orders daily public maps of where department vehicles speed and where they collide. The bill now sits in committee.
- 2026-01-29 · Sponsor · NYC Council – LegistarInt 0057-2026 sends DOT to study street design to curb commercial vehicles in residence districts. It moved to the Transportation and Infrastructure Committee on Jan. 29, 2026.
1945 Broadway, Brooklyn, NY 11207
718-642-8664
250 Broadway, Suite 1754, New York, NY 10007
212-788-7284
Other Geographies See nearby areas
▸ Other Geographies
AD 38 Assembly District 38 sits in Brooklyn, District 37, Precinct 75.
It contains Queens CB 5, Queens CB 9, Queens CB 82, Ridgewood, Glendale, Highland Park-Cypress Hills Cemeteries (North), Richmond Hill, Ozone Park (North), Woodhaven, Forest Park.
▸ See also
