Assembly District 51
Crash Narratives
Assembly District 51: Traffic Crash Statistics
Crash Counter for AD 51 622 crashes • 0 deaths
About these crash totals
Counts come from NYC police crash reports (NYPD Motor Vehicle Collisions on NYC Open Data). We sum all crashes, injuries, and deaths for this area across the selected time window shown on the card. Injury severity follows DOT's KABCO definitions mapped from the NYPD Person table (injury status, injury type, and injury location).
- Crashes: number of police‑reported collisions (all road users).
- All injuries: people with any reported injury (KABCO A/B/C or generic "injured").
- Moderate / Serious: suspected minor + suspected serious injuries (KABCO B + A).
- Deaths: killed or apparent death reported by police (KABCO K).
Change badges (arrows and percentages) compare the selected window with the same period last year whenever we have enough history. The “From 2022” view shows totals across the full span since 2022. When a comparison window isn’t available the badge shows an em dash.
Notes: Police reports can be corrected after initial publication. We cannot verify "death within 30 days" or hospital outcomes, so small differences from DOT totals are possible. Minor incidents without a police report are not included.
CloseCaught Speeding in AD 51 KZC2999 — 178 times
- 178 speed-camera tickets citywide in 12 monthsPA KZC2999 · 2019 Nissan SedanCaught here 1 time in the last 12 months.Typically speeds citywide in: Flatbush (West)-Ditmas Park-Parkville (13), Bensonhurst (11), and East Flatbush-Rugby (10).
- 160 speed-camera tickets citywide in 12 monthsNY KXH2766 · 2022 Gray Kia SedanCaught here 4 times in the last 12 months.Typically speeds citywide in: Tompkinsville-Stapleton-Clifton-Fox Hills (36), Mariner's Harbor-Arlington-Graniteville (29), and West New Brighton-Silver Lake-Grymes Hill (15).
- 156 speed-camera tickets citywide in 12 monthsNJ A35WNJ · 2024 Audi SedaCaught here 1 time in the last 12 months.Typically speeds citywide in: East Flatbush-Remsen Village (17), East Flatbush-Rugby (14), and Crown Heights (North) (13).
- 124 speed-camera tickets citywide in 12 monthsNY LFB3194 · 2023 Gray Toyota SuburbanCaught here 3 times in the last 12 months.Typically speeds citywide in: Tompkinsville-Stapleton-Clifton-Fox Hills (15), Port Richmond (15), and Mariner's Harbor-Arlington-Graniteville (13).
- 120 speed-camera tickets citywide in 12 monthsVA 7160XR · 2009 Gray Ford VanCaught here 1 time in the last 12 months.Typically speeds citywide in: Financial District-Battery Park City (21), Canarsie (17), and Flatlands (12).
About this list
This ranks vehicles caught speeding in this area during the latest 12-month window by the number of NYC school-zone speed-camera violations they received anywhere in the city during that same window.
Camera violations are issued by NYC DOT’s program. Counts reflect issued tickets and may omit dismissed or pending cases. Plate text is shown verbatim as recorded.
CloseDangerous Schools in AD 51 Loading school hotspots...
| School | Crashes
Injuries
Child injuries
Deaths |
|---|
Dangerous Streets in AD 51 Loading street hotspots...
| Street | Crashes
Injuries
Child injuries
Deaths |
|---|
Dangerous Intersections in AD 51 Loading intersection hotspots...
| Intersection | Crashes
Injuries
Child injuries
Deaths |
|---|
Crash Finder
Try Crash Finder
Look up any street, school, address, or intersection to see how safe the streets are.
AD 51 Hot Spots Danger zones and recent crashes
Traffic Safety Timeline Tap to view recent events
Carnage in AD 51 15 Whiplash (Neck)
▸ Crush Injuries 1
▸ Severe Bleeding 1
▸ Severe Lacerations 2
▸ Concussion 4
▸ Fracture/Dislocation 3
▸ Internal Injury 2
▸ Whiplash 40
▸ Contusion/Bruise 29
▸ Abrasion 11
▸ Pain/Nausea 7
Crashes by Hour in AD 51 4 PM • 28 injuries ↑27%
Who is getting hurt? Kids 34 injuries ↑26% Seniors 20 injuries ↓23%
Toggle on at least one mode to see people totals.
Totals count people injured or killed. Use the mode filters above to focus the stacks.
Dangerous Bike Lanes in AD 51 Loading bike lane hotspots...
| Bike lane | Crashes
Cyclist injuries
Child injuries
Cyclist deaths |
|---|
What Crashes Cost Here Loading estimate...
Loading crash cost estimate...
The three blocks below show direct costs, other harm, and the total for crashes with injuries, crashes without injuries, and all crashes together.
How we calculate this
We calculate these costs using a method developed by the National Highway Traffic Safety Administration, or NHTSA. It gives one set of costs for crashes with injuries and another for crashes with no reported injuries.
Crashes with injuries cost much more because the method includes things like lost work, medical care, and long-term harm. NHTSA says crash costs include "lost productivity, medical, legal and court costs, emergency service, insurance administration, congestion, property damage, and workplace losses."
These are estimates, not bills. "Other harm" is the part of the broader estimate that goes beyond direct bills and insurance claims. It captures pain, disability, and lost quality of life.
Download the math (CSV) · Download the math (JSON) · Method and sources
Preventable Speeding 1,452 16+ offenders ↓74%
Repeat School-Zone Speeding Offenders
- ≥ 6: 3,645 (2026 year-to-date) • Prev: 13,253 2025 year-to-date
- ≥ 16: 1,452 (2026 year-to-date) • Prev: 5,521 2025 year-to-date
Pedestrian Injuries 100% by Cars and Trucks ↓37%
About this chart
We group pedestrian injuries and deaths by the vehicle type that struck them (as recorded in police reports). Use the year selector to compare the current window with the prior period.
- Trucks/Buses, SUVs/Cars, Mopeds, and Bikes reflect the broad categories we use to track vehicle harm.
- Counts include people on foot only; crashes with no injured pedestrians do not appear in this card.
Notes: Police classification can change during investigations. Small categories may have year-to-year variance.
CloseAssembly Member Marcela Mitaynes F (50)*
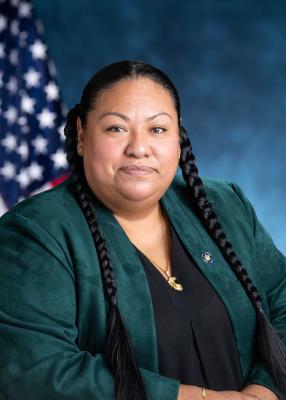
District 51
- 2022-09-08 · Leadership · gothamist.com · ↑ helps gradeCouncilmember Alexa Avilés pushes new rules to rein in e-commerce warehouses. The bill would block massive facilities near homes, schools, and parks. It demands public review and stricter permits. The aim: less truck traffic, cleaner air, safer streets.
- 2022-06-02 · Vote · Open States · ↑ helps gradeSenate passed S 5602 to keep school zone speed cameras running longer. More eyes on reckless drivers. Lawmakers push back against speeding near kids. The vote was clear. The danger remains.
- 2022-05-31 · Vote · Open States · ↓ hurts gradeAssembly and Senate passed A 8933. The bill shields emergency vehicle operators from fines for traffic violations during medical calls. Vulnerable road users face more risk. Accountability weakens. Streets grow more dangerous.
- 2022-05-31 · Vote · Open States · ↓ hurts gradeAssembly and Senate passed A 8933. The bill shields emergency vehicle operators from fines for traffic violations during medical calls. Vulnerable road users face more risk. Accountability weakens. Streets grow more dangerous.
- 2022-05-31 · Vote · Open States · ↓ hurts gradeAssembly and Senate passed A 8933. The bill shields emergency vehicle operators from fines for traffic violations during medical calls. Vulnerable road users face more risk. Accountability weakens. Streets grow more dangerous.
- 2022-05-31 · Vote · Open States · ↓ hurts gradeAssembly and Senate passed A 8933. The bill shields emergency vehicle operators from fines for traffic violations during medical calls. Vulnerable road users face more risk. Accountability weakens. Streets grow more dangerous.
- 2022-05-25 · Vote · Open States · ↑ helps gradeSenate passed S 5602 to keep school zone speed cameras running longer. More eyes on reckless drivers. Lawmakers push back against speeding near kids. The vote was clear. The danger remains.
- 2022-05-23 · Vote · Open States · ↑ helps gradeSenate and Assembly passed S 1078. New drivers must now learn how to avoid hitting people on foot or bike. Law aims to cut crashes at the root—before drivers get the keys.
- 2023-11-29 · Leadership · brooklynpaper.com · ↑ helps gradeRed Hook chokes on truck fumes. Lawmakers move. The Clean Deliveries Act aims to cut emissions from sprawling e-commerce warehouses. Kristen Gonzalez and others demand action. Diesel trucks crowd narrow streets. Pollution and danger rise. Residents pay the price.
- 2023-07-18 · Leadership · amny.com · ↑ helps gradeBrooklyn officials demand equal tolls on all Manhattan crossings. They warn free bridges funnel traffic into certain neighborhoods. Their letter calls for fairness. The MTA stays silent. The Traffic Mobility Review Board will decide. Streets hang in the balance.
- 2023-06-06 · Vote · Open States · ↑ helps gradeAlbany gets speed cameras near schools. Lawmakers pass A 7043. Cameras catch drivers who endanger kids. The program runs until 2028. Streets near schools face new watchful eyes.
- 2023-06-06 · Vote · Open States · ↑ helps gradeAlbany gets speed cameras near schools. Lawmakers pass A 7043. Cameras catch drivers who endanger kids. The program runs until 2028. Streets near schools face new watchful eyes.
- 2023-02-21 · Sponsor · Open States · ↑ helps gradeAssembly Bill 4637 would use cameras to keep cars out of bike lanes. The bill targets drivers who block protected lanes. Sponsors say it will protect cyclists from deadly crashes.
- 2023-02-14 · Leadership · Streetsblog NYC · ↑ helps gradeLawmakers push two bills. One widens legal cargo bikes. One reins in dirty warehouses. Both target truck traffic choking city streets. Sponsors say the measures will cut pollution, asthma, and danger for people outside cars. Albany momentum grows.
- 2023-02-13 · Vote · Open States · ↑ helps gradeAssembly and Senate passed A 602. The bill sets state funding rules for federally assisted and municipal complete street projects. Lawmakers moved fast. Streets shaped by budgets, not safety.
- 2023-02-10 · Leadership · Streetsblog NYC · ↓ hurts gradeEighteen Brooklyn officials demand state DOT address BQE’s full deadly stretch. They reject piecemeal fixes. They call out decades of harm. The state’s refusal leaves neighborhoods exposed. The city’s hands are tied. The highway’s danger remains. Vulnerable lives hang in the balance.
- 2024-06-07 · Vote · Open States · ↑ helps gradeAssembly passes A 7652. Schenectady gets school speed cameras. Law aims to slow drivers near kids. Cameras expire in 2028. Vote split. Streets may get safer for children on foot.
- 2024-06-07 · Vote · Open States · ↑ helps gradeAssembly passes A 7652. Schenectady gets school speed cameras. Law aims to slow drivers near kids. Cameras expire in 2028. Vote split. Streets may get safer for children on foot.
- 2024-06-07 · Vote · Open States · ↑ helps gradeLawmakers back speed cameras near Kingston schools. Cameras catch drivers who speed. The bill passed both chambers. It sunsets in 2029. Children and families walk safer, but the fix is temporary.
- 2024-06-06 · Vote · Open States · ↑ helps gradeLawmakers back speed cameras near Kingston schools. Cameras catch drivers who speed. The bill passed both chambers. It sunsets in 2029. Children and families walk safer, but the fix is temporary.
- 2024-04-18 · Vote · Open States · ↑ helps gradeMitaynes votes yes on transportation budget bill with no safety impact.
- 2024-04-18 · Vote · Open States · ↑ helps gradeMitaynes votes yes on transportation budget bill with no safety impact.
- 2024-04-02 · Vote · Open States · ↑ helps gradeMitaynes votes yes to require recall checks before used car sales.
- 2024-01-23 · Leadership · Streetsblog NYC · ↑ helps gradeEvery day, 9,000 trucks thunder through Sunset Park and Red Hook. Warehouses choke streets. Black and Latino residents breathe the fumes and dodge danger. Lawmakers push the Clean Deliveries Act to curb the chaos. The burden falls hard. The fight is on.
- 2025-07-24 · Leadership · BKReader · ↑ helps gradeEighty dead or maimed on Third Avenue since 2018. Sunset Park stands up. Residents, officials, and advocates demand the city end delays. No fixes yet. Danger remains.
- 2025-07-23 · Leadership · Brooklyn Paper · ↓ hurts gradeTwo pedestrians killed. Advocates and local leaders demand action. City stalls. Third Avenue stays deadly. Anger and grief fill Sunset Park.
- 2025-06-17 · Vote · Open States · ↑ helps gradeSenate passes S 8344. School speed zone rules in New York City get extended. Lawmakers make technical fixes. The bill keeps pressure on drivers near schools. Streets stay a little safer for kids.
- 2025-06-16 · Vote · Open States · ↓ hurts gradeSenate passed S 7785. The bill carves out large Mitchell-Lama housing from bus traffic rules. Lawmakers voted yes. The carve-out weakens enforcement. Streets grow less safe for people on foot and bike.
- 2025-05-07 · Vote · Open States · ↑ helps gradeMitaynes votes yes on transportation budget bill with no safety impact.
- 2025-05-07 · Vote · Open States · ↑ helps gradeMitaynes votes yes on transportation budget bill with no safety impact.
- 2025-02-14 · Sponsor · Open States · ↑ helps gradeAssembly bill A 5440 targets reckless drivers. It makes car owners pay when their vehicles run red lights. Cameras catch the lawbreakers. The aim: fewer crashes, safer streets for all.
- 2025-01-16 · Sponsor · Open States · ↑ helps gradeAssembly bill A 2299 targets reckless drivers. Eleven points or six camera tickets in a year triggers forced speed control tech. Lawmakers move to curb repeat speeders. Streets demand fewer deadly risks.
- 2026-01-30 · Sponsor · Open StatesMitaynes co-sponsors climate and community investment act, with no safety impact.
- 2026-01-23 · Leadership · Streetsblog Empire State · ↓ hurts gradeAlbany held a hearing on e-bikes. Lawmakers mixed up classes and speed. Some floated car-style licensing and insurance. The talk could squeeze riders while bigger crash danger keeps rolling.
- 2025-07-24 · Leadership · BKReader · ↑ helps gradeEighty dead or maimed on Third Avenue since 2018. Sunset Park stands up. Residents, officials, and advocates demand the city end delays. No fixes yet. Danger remains.
- 2025-07-23 · Leadership · Brooklyn Paper · ↓ hurts gradeTwo pedestrians killed. Advocates and local leaders demand action. City stalls. Third Avenue stays deadly. Anger and grief fill Sunset Park.
4907 4th Ave. Suite 1A, Brooklyn, NY 11220
718-492-6334
Room 741, Legislative Office Building, Albany, NY 12248
518-455-3821
Council Member Alexa Avilés A (99)
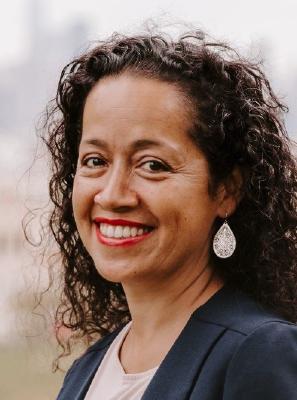
District 38
- 2024-12-19 · Vote · NYC Council – Legistar · ↓ hurts gradeAvilés votes yes on bill requiring FDNY consultation for street projects.
- 2024-12-05 · Sponsor · NYC Council – Legistar · ↑ helps gradeCouncil bill bars cars from blocking crosswalks. No standing or parking within 20 feet. City must install daylighting barriers at 1,000 intersections yearly. Streets clear. Sightlines open. Danger cut.
- • Neutral2024-09-26 · Sponsor · NYC Council – LegistarCouncil bill slashes legal parking time for big rigs. Ninety minutes max for tractor-trailers. Three hours for other commercial trucks. Streets clear faster. Heavy metal moves on.
- 2024-09-26 · Vote · NYC Council – Legistar · ↑ helps gradeCouncil ends jaywalking penalties. Pedestrians now cross anywhere, any time. No summons. Law strips drivers of excuses. Streets shift. Power tilts to people on foot.
- 2024-04-18 · Sponsor · NYC Council – Legistar · ↑ helps gradeCouncil orders swift removal of abandoned and unplated cars. Streets clear in 72 hours. Police target vehicles with missing or fake plates. Fewer hazards for those on foot and bike.
- 2024-03-19 · Sponsor · NYC Council – Legistar · ↑ helps gradeCouncil bill orders DOT to repair broken curbs during street resurfacing. Hazardous curbs trip, trap, and injure. The fix is overdue. Pedestrians need solid ground. Council moves to force action.
- 2024-03-07 · Sponsor · NYC Council – Legistar · ↑ helps gradeCouncil bill demands DOT fix NYCHA sidewalks first. Seniors come before all. Broken walks trip, injure, kill. Law forces city to show its work. No more hiding behind red tape.
- 2024-02-28 · Sponsor · NYC Council – Legistar · ↑ helps gradeCouncil moves to outlaw fake plates. Fraud hides reckless drivers. Bill targets sellers, sets fines. Streets need truth. Law aims to strip shields from danger.
- 2025-10-29 · Sponsor · NYC Council – Legistar · ↑ helps gradeStricter limits, supervisor authorization, and a ban on PIT maneuvers reduce the frequency and intensity of high‑speed chases, lowering risk to pedestrians and cyclists. Aerial handoff and disengagement further shift enforcement away from dangerous street pursuits, improving system-wide safety.
- 2025-10-29 · Sponsor · NYC Council – LegistarInt 1446-2025 forces DOT to accept sidewalk and roadway cafe applications online and at public locations. Applicants can save drafts. It bars mandatory professional drawing approval while preserving DOT review of required clearances.
- 2025-08-26 · Leadership · amny.com · ↑ helps gradeMayor Adams vetoed a council push to decriminalize street vending. Vendors clustered on the narrow Brooklyn Bridge walkway. Crowding squeezes pedestrians, collides with cyclists and strollers, and can impede emergency movement, raising crash and injury risk.
- 2025-07-24 · Leadership · BKReader · ↑ helps gradeEighty dead or maimed on Third Avenue since 2018. Sunset Park stands up. Residents, officials, and advocates demand the city end delays. No fixes yet. Danger remains.
- 2025-05-28 · Sponsor · NYC Council – Legistar · ↑ helps gradeCouncil pushes a bill to cut bike share costs for New Yorkers over 65. The measure aims to open city cycling to more seniors. The committee now weighs its next move.
- 2025-05-28 · Sponsor · NYC Council – Legistar · ↑ helps gradeCouncil bill pushes for discounted bike share rates for New Yorkers 65 and up. The move aims to open city streets to older riders. The measure sits with the Transportation Committee. No safety review yet.
- 2025-05-01 · Vote · NYC Council – LegistarCouncil passes law. Taxis and for-hire cars must post bold warnings on rear doors. Riders face the message: look for cyclists before swinging the door. A move to cut dooring. City acts. Cyclists stay in the crosshairs.
- 2025-04-10 · Vote · NYC Council – Legistar · ↑ helps gradeCouncil passed a law forcing DOT to post sharp, regular updates on street safety projects. Progress on bike lanes, bus lanes, and signals must go public. No more hiding delays or cost overruns. The city must show its work.
- 2026-05-08 · Leadership · Streetsblog NYC · ↓ hurts gradeAfter her truck-map bill widened routes, Alexa Avilés demanded fewer trucks. City Hall moves to expand the network anyway. Big rigs and blind spots press closer to sidewalks and bike lanes.
- 2026-05-07 · Leadership · Streetsblog NYC · ↑ helps gradeGreen-Wood pitched a two-way protected bike path and wider sidewalks. The corridor has seen 97 crashes, 128 injuries, and three deaths. It would trade curb parking for space where people walk and ride.
- • Neutral2026-02-24 · Sponsor · NYC Council – LegistarAvilés primarily sponsors bill setting NYPD firearm discharge blood alcohol testing procedures
- 2026-02-24 · Sponsor · NYC Council – LegistarAvilés primarily sponsors bill establishing officer blood alcohol testing after shootings.
4417 4th Avenue, Ground Floor, Brooklyn, NY 11220
718-439-9012
250 Broadway, Suite 1746, New York, NY 10007
212-788-7387
Other Geographies See nearby areas
▸ Other Geographies
AD 51 Assembly District 51 sits in Brooklyn, District 38, Precinct 72.
It contains Brooklyn CB 6, Brooklyn CB 7, Carroll Gardens-Cobble Hill-Gowanus-Red Hook, Sunset Park (West), Sunset Park (Central), Green-Wood Cemetery, Sunset Park (East)-Borough Park (West).
▸ See also
