Assembly District 52
Crash Narratives
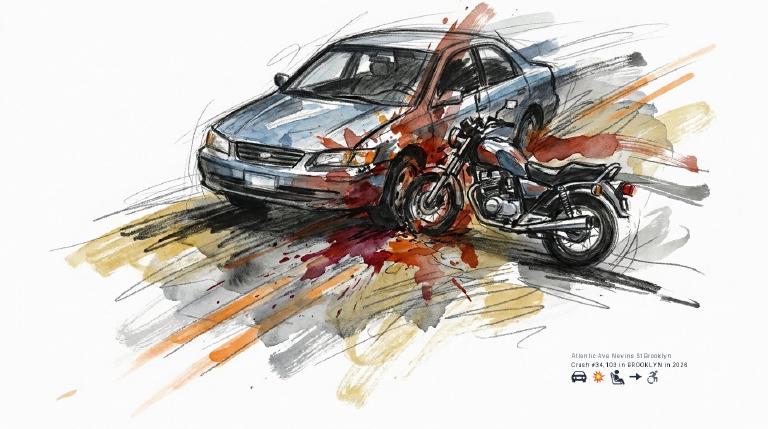
Left-turning driver slams motorcyclist
A driver making a left turn hit a 49-year-old motorcyclist on Atlantic Avenue at Nevins Street. The rider was ejected and suffered a knee/lower-leg/foot fracture and dislocation.
Assembly District 52: Traffic Crash Statistics
Crash Counter for AD 52 810 crashes • 1 deaths
About these crash totals
Counts come from NYC police crash reports (NYPD Motor Vehicle Collisions on NYC Open Data). We sum all crashes, injuries, and deaths for this area across the selected time window shown on the card. Injury severity follows DOT's KABCO definitions mapped from the NYPD Person table (injury status, injury type, and injury location).
- Crashes: number of police‑reported collisions (all road users).
- All injuries: people with any reported injury (KABCO A/B/C or generic "injured").
- Moderate / Serious: suspected minor + suspected serious injuries (KABCO B + A).
- Deaths: killed or apparent death reported by police (KABCO K).
Change badges (arrows and percentages) compare the selected window with the same period last year whenever we have enough history. The “From 2022” view shows totals across the full span since 2022. When a comparison window isn’t available the badge shows an em dash.
Notes: Police reports can be corrected after initial publication. We cannot verify "death within 30 days" or hospital outcomes, so small differences from DOT totals are possible. Minor incidents without a police report are not included.
CloseCaught Speeding in AD 52 RUN1724 — 193 times
- 193 speed-camera tickets citywide in 12 monthsGA RUN1724 · 2020 Black BMW MpCaught here 11 times in the last 12 months.Typically speeds citywide in: Crown Heights (North) (82), Prospect Heights (15), and Spring Creek-Starrett City (13).
- 184 speed-camera tickets citywide in 12 monthsGA SGY7043 · 2021 White Mercedes-Benz 4SCaught here 1 time in the last 12 months.Typically speeds citywide in: Canarsie (50), Sheepshead Bay-Manhattan Beach-Gerritsen Beach (19), and Baisley Park (16).
- 182 speed-camera tickets citywide in 12 monthsNY KZF9054 · 2023 Black Mitsubishi SuburbanCaught here 3 times in the last 12 months.Typically speeds citywide in: East New York-New Lots (12), Crown Heights (North) (10), and Bedford Park (9).
- 178 speed-camera tickets citywide in 12 monthsPA KZC2999 · 2019 Nissan SedanCaught here 1 time in the last 12 months.Typically speeds citywide in: Flatbush (West)-Ditmas Park-Parkville (13), Bensonhurst (11), and East Flatbush-Rugby (10).
- 164 speed-camera tickets citywide in 12 monthsNY LHW6019 · 2024 Gray Toyota SedanCaught here 3 times in the last 12 months.Typically speeds citywide in: Crown Heights (North) (13), East New York-New Lots (8), and Ocean Hill (8).
About this list
This ranks vehicles caught speeding in this area during the latest 12-month window by the number of NYC school-zone speed-camera violations they received anywhere in the city during that same window.
Camera violations are issued by NYC DOT’s program. Counts reflect issued tickets and may omit dismissed or pending cases. Plate text is shown verbatim as recorded.
CloseDangerous Schools in AD 52 Loading school hotspots...
| School | Crashes
Injuries
Child injuries
Deaths |
|---|
Dangerous Streets in AD 52 Loading street hotspots...
| Street | Crashes
Injuries
Child injuries
Deaths |
|---|
Dangerous Intersections in AD 52 Loading intersection hotspots...
| Intersection | Crashes
Injuries
Child injuries
Deaths |
|---|
Crash Finder
Try Crash Finder
Look up any street, school, address, or intersection to see how safe the streets are.
AD 52 Hot Spots Danger zones and recent crashes
Traffic Safety Timeline Tap to view recent events
Carnage in AD 52 9 Contusion/Bruise (Lower leg/foot)
▸ Killed 1
▸ Crush Injuries 2
▸ Severe Bleeding 5
▸ Severe Lacerations 1
▸ Concussion 5
▸ Fracture/Dislocation 4
▸ Internal Injury 7
▸ Whiplash 18
▸ Contusion/Bruise 27
▸ Abrasion 8
▸ Pain/Nausea 21
Crashes by Hour in AD 52 6 PM • 38 injuries ↑171%
Who is getting hurt? Kids 12 injuries ↓14% Seniors 26 injuries ↑53%
Toggle on at least one mode to see people totals.
Totals count people injured or killed. Use the mode filters above to focus the stacks.
Dangerous Bike Lanes in AD 52 Loading bike lane hotspots...
| Bike lane | Crashes
Cyclist injuries
Child injuries
Cyclist deaths |
|---|
What Crashes Cost Here Loading estimate...
Loading crash cost estimate...
The three blocks below show direct costs, other harm, and the total for crashes with injuries, crashes without injuries, and all crashes together.
How we calculate this
We calculate these costs using a method developed by the National Highway Traffic Safety Administration, or NHTSA. It gives one set of costs for crashes with injuries and another for crashes with no reported injuries.
Crashes with injuries cost much more because the method includes things like lost work, medical care, and long-term harm. NHTSA says crash costs include "lost productivity, medical, legal and court costs, emergency service, insurance administration, congestion, property damage, and workplace losses."
These are estimates, not bills. "Other harm" is the part of the broader estimate that goes beyond direct bills and insurance claims. It captures pain, disability, and lost quality of life.
Download the math (CSV) · Download the math (JSON) · Method and sources
Preventable Speeding 2,452 16+ offenders ↓61%
Repeat School-Zone Speeding Offenders
- ≥ 6: 6,287 (2026 year-to-date) • Prev: 15,200 2025 year-to-date
- ≥ 16: 2,452 (2026 year-to-date) • Prev: 6,243 2025 year-to-date
Pedestrian Injuries 95% by Cars and Trucks ↑9.6%
About this chart
We group pedestrian injuries and deaths by the vehicle type that struck them (as recorded in police reports). Use the year selector to compare the current window with the prior period.
- Trucks/Buses, SUVs/Cars, Mopeds, and Bikes reflect the broad categories we use to track vehicle harm.
- Counts include people on foot only; crashes with no injured pedestrians do not appear in this card.
Notes: Police classification can change during investigations. Small categories may have year-to-year variance.
CloseAssembly Member Jo Anne Simon F (50)*
District 52
- 2022-12-22 · Leadership · streetsblog.org · ↑ helps gradeCity and state officials want to drop the legal blood-alcohol limit to 0.05. The bill sits in committee. Drunk drivers killed 42 people last year. Officials talk tough but focus on drinking, not driving. The danger remains for those outside the car.
- 2022-12-22 · Leadership · Streetsblog NYC · ↑ helps gradeCity officials push Albany to drop the drunk driving threshold from 0.08 to 0.05 percent. The bill lingers in committee. Drunk drivers killed 42 New Yorkers last year. Messaging still centers on not drinking, not on not driving.
- 2022-10-21 · Leadership · brooklynpaper.com · ↑ helps gradeCouncilmember Restler and Brooklyn leaders want DOT to flip Bond Street’s traffic northbound after Schermerhorn’s redesign. Locals face gridlock. Community Board 2 backs the move. They demand DOT protect the Bond Street bike lane with a physical barrier.
- 2022-10-12 · Leadership · amny.com · ↑ helps gradeOfficials cut the ribbon on a fortified, two-way bike lane on Schermerhorn Street. Cyclists now ride behind parked cars, shielded from traffic. The old, chaotic street saw 29 cyclist injuries and one death. Councilmember Restler pushed for this change.
- 2022-05-31 · Vote · Open States · ↓ hurts gradeAssembly and Senate passed A 8933. The bill shields emergency vehicle operators from fines for traffic violations during medical calls. Vulnerable road users face more risk. Accountability weakens. Streets grow more dangerous.
- 2022-05-31 · Vote · Open States · ↓ hurts gradeAssembly and Senate passed A 8933. The bill shields emergency vehicle operators from fines for traffic violations during medical calls. Vulnerable road users face more risk. Accountability weakens. Streets grow more dangerous.
- 2022-05-25 · Vote · Open States · ↑ helps gradeSenate passed S 5602 to keep school zone speed cameras running longer. More eyes on reckless drivers. Lawmakers push back against speeding near kids. The vote was clear. The danger remains.
- 2022-05-23 · Vote · Open States · ↑ helps gradeSenate and Assembly passed S 1078. New drivers must now learn how to avoid hitting people on foot or bike. Law aims to cut crashes at the root—before drivers get the keys.
- 2023-09-18 · Leadership · Streetsblog NYC · ↓ hurts gradeDOT stripped protected bike lanes from Brooklyn’s Fourth Avenue. Cyclists now dodge cars and illegal parking. Elected officials and advocates demand action. DOT cites traffic, but danger grows. Pedestrians lose safe crossings. The agency stays silent. Streets stay deadly.
- 2023-08-18 · Sponsor · Open States · ↑ helps gradeAssembly bill A 7979 targets reckless drivers. Eleven points or six camera tickets triggers a speed limiter. Lawmakers move to curb repeat danger. No more unchecked speeding. Streets demand it.
- 2023-08-18 · Leadership · Streetsblog NYC · ↓ hurts gradeCivic groups blasted Mayor Adams’s BQE plan. They called it car- and truck-centric. The city wants more lanes and a new off-ramp. Critics say this endangers communities and ignores transit. Local leaders demand fewer cars, safer streets, and real change.
- 2023-07-18 · Leadership · amny.com · ↑ helps gradeBrooklyn officials demand equal tolls on all Manhattan crossings. They warn free bridges funnel traffic into certain neighborhoods. Their letter calls for fairness. The MTA stays silent. The Traffic Mobility Review Board will decide. Streets hang in the balance.
- 2023-05-31 · Leadership · Streetsblog NYC · ↓ hurts gradeAlbany lawmakers refuse to vote on Sammy’s Law. The bill would let New York City lower speed limits below 25 mph. Council and mayor back it. Assembly leadership stalls. Streets stay dangerous. Families wait. The city’s hands remain tied.
- 2023-05-26 · Leadership · amny.com · ↑ helps gradeNYPD and Jo Anne Simon call for tougher drunk driving laws. Police ramp up DWI patrols for Memorial Day. Officials urge Albany to drop legal BAC to .05%. They cite rising deaths. Advocates say alcohol fuels a third of crashes. Streets stay deadly.
- 2023-03-04 · Leadership · Streetsblog NYC · ↓ hurts gradeBrooklyn power players met behind closed doors. They fought to keep the BQE wide and fast. Former party boss Frank Seddio led the charge. Some officials want fewer lanes for cleaner air and safer streets. City Hall claims neutrality. The debate rages on.
- 2023-02-21 · Sponsor · Open States · ↑ helps gradeAssembly Bill 4637 would use cameras to keep cars out of bike lanes. The bill targets drivers who block protected lanes. Sponsors say it will protect cyclists from deadly crashes.
- 2024-06-26 · Leadership · Streetsblog NYC · ↓ hurts gradeAssembly Member Jo Anne Simon pushes a bill to ban parking near intersections citywide. The move targets deadly corners where cars block sightlines. Sixteen community boards and dozens of officials back it. DOT drags its feet. Advocates demand action.
- 2024-06-07 · Vote · Open States · ↑ helps gradeAssembly passes A 7652. Schenectady gets school speed cameras. Law aims to slow drivers near kids. Cameras expire in 2028. Vote split. Streets may get safer for children on foot.
- 2024-06-07 · Vote · Open States · ↑ helps gradeAssembly passes A 7652. Schenectady gets school speed cameras. Law aims to slow drivers near kids. Cameras expire in 2028. Vote split. Streets may get safer for children on foot.
- 2024-06-07 · Vote · Open States · ↑ helps gradeLawmakers back speed cameras near Kingston schools. Cameras catch drivers who speed. The bill passed both chambers. It sunsets in 2029. Children and families walk safer, but the fix is temporary.
- 2024-04-26 · Sponsor · Open States · ↑ helps gradeAssembly bill A 9921 targets cars blocking crosswalks. Makes parking in pedestrian paths a crime. Law aims to clear the way for walkers. Sponsors push for safer streets. No more cars in the crosswalk.
- 2024-04-18 · Vote · Open States · ↑ helps gradeSimon votes yes on transportation budget bill with no safety impact.
- 2024-04-18 · Vote · Open States · ↑ helps gradeSimon votes yes on transportation budget bill with no safety impact.
- 2024-04-02 · Vote · Open States · ↑ helps gradeSimon votes yes to require recall checks before used car sales.
- 2025-08-11 · Leadership · BKReader · ↑ helps gradeElevators planned for Smith‑9th Street, NYC's tallest station. Stairs end. Riders with limited mobility win. NYCHA residents and seniors regain access to jobs and care. Project cuts forced walking or biking along hazardous routes and shifts trips onto public transit.
- 2025-08-11 · Leadership · Brooklyn Paper · ↑ helps gradeMTA will add elevators to Smith‑9th Street, ending a brutal 90‑foot climb. The change opens the station to seniors and people with disabilities. More transit riders may mean fewer cars, cutting pedestrian and cyclist exposure to traffic danger.
- 2025-08-10 · Leadership · Brooklyn Paper · ↑ helps gradeState officials will add elevators to Smith-9th Street station, ending a brutal 90‑foot climb. The lifts expand access and push riders toward transit — cutting pedestrian and cyclist exposure to street car traffic and easing danger for vulnerable users.
- 2025-06-17 · Vote · Open States · ↑ helps gradeSenate passes S 8344. School speed zone rules in New York City get extended. Lawmakers make technical fixes. The bill keeps pressure on drivers near schools. Streets stay a little safer for kids.
- 2025-05-07 · Vote · Open States · ↑ helps gradeSimon votes yes on transportation budget bill with no safety impact.
- 2025-05-07 · Vote · Open States · ↑ helps gradeSimon votes yes on transportation budget bill with no safety impact.
- 👎 Negative2025-04-16 · Sponsor · Open States · ↓ hurts gradeAssembly bill A 7997 lets speed cameras catch drivers hiding or altering plates. It extends camera use in school zones. Lawmakers push to close loopholes that shield reckless drivers from accountability.
- 2025-04-03 · Leadership · Streetsblog NYC · ↑ helps gradeBrooklyn’s Ashland Place stays deadly. DOT delays a promised bike lane. Elected officials and residents demand action. Private interests block progress. Cyclists face crashes and fear. The city shrugs. The gap remains. Lives hang in the balance.
- 2026-01-30 · Sponsor · Open StatesSimon co-sponsors climate and community investment act, with no safety impact.
- 2026-01-30 · Sponsor · Open StatesSimon co-sponsors climate and community investment act, with no safety impact.
- 2025-08-11 · Leadership · BKReader · ↑ helps gradeElevators planned for Smith‑9th Street, NYC's tallest station. Stairs end. Riders with limited mobility win. NYCHA residents and seniors regain access to jobs and care. Project cuts forced walking or biking along hazardous routes and shifts trips onto public transit.
- 2025-08-11 · Leadership · Brooklyn Paper · ↑ helps gradeMTA will add elevators to Smith‑9th Street, ending a brutal 90‑foot climb. The change opens the station to seniors and people with disabilities. More transit riders may mean fewer cars, cutting pedestrian and cyclist exposure to traffic danger.
- 2025-08-10 · Leadership · Brooklyn Paper · ↑ helps gradeState officials will add elevators to Smith-9th Street station, ending a brutal 90‑foot climb. The lifts expand access and push riders toward transit — cutting pedestrian and cyclist exposure to street car traffic and easing danger for vulnerable users.
341 Smith St., Brooklyn, NY 11231
718-246-4889
Room 826, Legislative Office Building, Albany, NY 12248
518-455-5426
Council Member Lincoln Restler A (100)

District 33
- 2024-12-19 · Vote · NYC Council – Legistar · ↑ helps gradeRestler votes no on bill requiring FDNY input on street projects.
- 2024-12-05 · Sponsor · NYC Council – Legistar · ↑ helps gradeCouncil bill bars cars from blocking crosswalks. No standing or parking within 20 feet. City must install daylighting barriers at 1,000 intersections yearly. Streets clear. Sightlines open. Danger cut.
- • Neutral2024-09-26 · Sponsor · NYC Council – LegistarCouncil bill slashes legal parking time for big rigs. Ninety minutes max for tractor-trailers. Three hours for other commercial trucks. Streets clear faster. Heavy metal moves on.
- 2024-09-26 · Sponsor · NYC Council – Legistar · ↑ helps gradeCouncil pushes Albany to let New York City ticket drivers who block bike lanes. Cameras would catch violators. Cyclists face deadly risk. Lawmakers demand action. Streets must protect the vulnerable.
- 2024-05-16 · Sponsor · NYC Council – Legistar · ↑ helps gradeCouncil moves to light up step streets. At least 25 stairways each year will get new lamps. Dark paths become visible. Pedestrians gain ground. Shadows shrink. Danger loses its cover.
- 2024-04-18 · Sponsor · NYC Council – LegistarCouncil moves to hike fines for illegal ATVs and dirt bikes. First offense: $375–$750. Repeat: $750–$1,500. Law aims at reckless riders who menace city streets and endanger lives.
- 2024-04-18 · Sponsor · NYC Council – Legistar · ↑ helps gradeCouncil orders swift removal of abandoned and unplated cars. Streets clear in 72 hours. Police target vehicles with missing or fake plates. Fewer hazards for those on foot and bike.
- 2024-04-18 · Sponsor · NYC Council – LegistarCouncil bill orders DOT to factor traffic enforcement agents into city safety plans. The move targets deadly streets. Sponsors demand action, not words. Vulnerable New Yorkers wait for safer crossings.
- 2025-11-25 · Leadership · City & State NY · ↑ helps gradeAdrienne Adams defended the outdoor dining program as continuity. Lawmakers pushed to restore pandemic-era, year-round curb cafes. Reclaiming curb space from cars can calm traffic and tend to improve safety for pedestrians and cyclists.
- 2025-10-29 · Sponsor · NYC Council – Legistar · ↓ hurts gradeCouncil bill would cap the clear pedestrian path in front of sidewalk cafes at eight feet. Introduced and sent to the Committee on Transportation and Infrastructure on Oct. 29, 2025. The change narrows walking space and raises conflict risk for pedestrians and cyclists.
- 2025-10-29 · Sponsor · NYC Council – LegistarInt 1446-2025 forces DOT to accept sidewalk and roadway cafe applications online and at public locations. Applicants can save drafts. It bars mandatory professional drawing approval while preserving DOT review of required clearances.
- 2025-10-29 · Sponsor · NYC Council – Legistar · ↑ helps gradeCouncil bill forces DOT to accept sidewalk and roadway cafe petitions online and at public offices, lets applicants save drafts, and bars DOT from requiring professional-drawn plans. Introduced and sent to the Transportation Committee on Oct 29, 2025.
- 2025-05-28 · Sponsor · NYC Council – Legistar · ↑ helps gradeCouncil pushes a bill to cut bike share costs for New Yorkers over 65. The measure aims to open city cycling to more seniors. The committee now weighs its next move.
- 2025-05-28 · Sponsor · NYC Council – Legistar · ↑ helps gradeCouncil pushes cheaper bike share for students 16 and up. More teens on bikes. Streets shift. Danger remains. The bill sits in committee. Cyclists wait.
- 2025-05-01 · Vote · NYC Council – LegistarCouncil passes law. Taxis and for-hire cars must post bold warnings on rear doors. Riders face the message: look for cyclists before swinging the door. A move to cut dooring. City acts. Cyclists stay in the crosshairs.
- 2025-04-29 · Leadership · Streetsblog NYC · ↑ helps gradeCouncil members slammed NYPD brass for denying racial bias in traffic enforcement. Data shows Black drivers face more searches and arrests. NYPD blamed crime patterns. Lawmakers called it an excuse. The city’s history of biased policing loomed large.
- 2026-06-01 · Leadership · AMNY · ↓ hurts gradeCouncil grilled NYPD Commissioner Jessica Tisch on the new Office of Community Safety. She said talks “have not yet commenced.” The gap leaves street-safety work split and slow for pedestrians and cyclists.
- 2026-05-27 · Leadership · Brooklyn Paper · ↑ helps gradeDOT began work this week north of Calyer Street. It will remove a traffic lane each way and add parking-protected bike lanes to Freeman Street. The boulevard has long hurt walkers and riders.
- 2026-05-14 · Sponsor · NYC Council – Legistar · ↑ helps gradeRes 0467-2026 landed in committee. It presses Albany to let NYC use cameras to ticket drivers who block intersections and crosswalks. The gridlock traps people in the crosswalk.
- 2026-05-08 · Leadership · Brooklyn Paper · ↑ helps gradeA cracked asphalt lot at McCarren Park is set for green space. NYC Parks gathered 325 voices for dog runs, courts, and lawns. Less pavement. More people on foot.
410 Atlantic Avenue, Brooklyn, NY 11217
718-875-5200
250 Broadway, Suite 1748, New York, NY 10007
212-788-7214
Other Geographies See nearby areas
▸ Other Geographies
AD 52 Assembly District 52 sits in Brooklyn, District 33, Precinct 84.
It contains Brooklyn CB 2, Brooklyn CB 6, Brooklyn Heights, Downtown Brooklyn-DUMBO-Boerum Hill, Brooklyn Navy Yard, Carroll Gardens-Cobble Hill-Gowanus-Red Hook, Park Slope.
▸ See also
