Assembly District 71
Crash Narratives
Assembly District 71 turns violent in a week
Four crashes left four people seriously hurt in Assembly District 71.
From May 23 to May 30, Assembly District 71 saw 4 crashes and 4 serious injuries. It is a place that is usually quiet, then it isn’t.
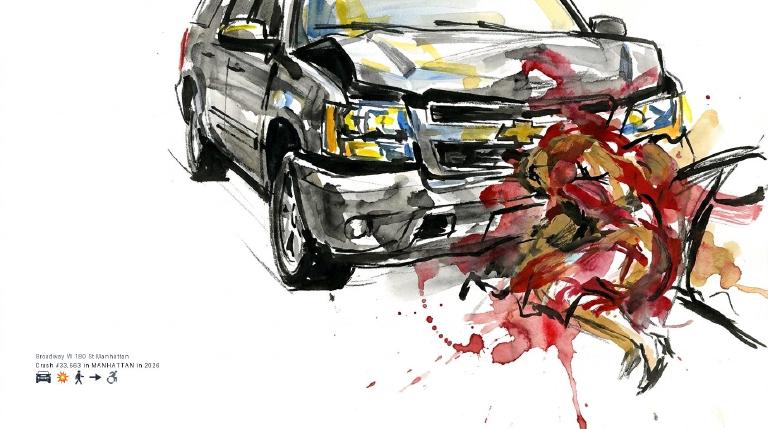
On Broadway at W 180th Street, a driver backing an SUV hit a 40-year-old woman. On W 145th Street, an ATV driver hit a 21-year-old pedestrian as police noted road rage and distraction. This district has fired once in the past 90 days and once in 365. Assembly Member Al Taylor can back street redesigns and enforcement that slow drivers down, and support Assembly bill A 2299 on speed limiters for repeat speeders.
- 4 crashes in last 7 days
- 4 serious injuries
- On W 145th Street, a driver on an ATV hit a 21-year-old pedestrian. Police recorded aggressive driving/road rage and driver inattention; the victim suffered severe head lacerations.
- A driver backing an SUV on Broadway hit a 40-year-old woman as she crossed near W 180th Street. She was injured in the knee and lower leg.
- A driver reacting to another vehicle on the Henry Hudson Parkway set off a chain-hit that left a 38-year-old driver with a concussion.
Assembly District 71: Traffic Crash Statistics
Crash Counter for AD 71 410 crashes • 3 deaths
About these crash totals
Counts come from NYC police crash reports (NYPD Motor Vehicle Collisions on NYC Open Data). We sum all crashes, injuries, and deaths for this area across the selected time window shown on the card. Injury severity follows DOT's KABCO definitions mapped from the NYPD Person table (injury status, injury type, and injury location).
- Crashes: number of police‑reported collisions (all road users).
- All injuries: people with any reported injury (KABCO A/B/C or generic "injured").
- Moderate / Serious: suspected minor + suspected serious injuries (KABCO B + A).
- Deaths: killed or apparent death reported by police (KABCO K).
Change badges (arrows and percentages) compare the selected window with the same period last year whenever we have enough history. The “From 2022” view shows totals across the full span since 2022. When a comparison window isn’t available the badge shows an em dash.
Notes: Police reports can be corrected after initial publication. We cannot verify "death within 30 days" or hospital outcomes, so small differences from DOT totals are possible. Minor incidents without a police report are not included.
CloseCaught Speeding in AD 71 LHW6019 — 164 times
- 164 speed-camera tickets citywide in 12 monthsNY LHW6019 · 2024 Gray Toyota SedanCaught here 1 time in the last 12 months.Typically speeds citywide in: Crown Heights (North) (13), East New York-New Lots (8), and Ocean Hill (8).
- 159 speed-camera tickets citywide in 12 monthsNY LTJ3931 · 2022 Whbk Mercedes-Benz SuburbanCaught here 19 times in the last 12 months.Typically speeds citywide in: Upper West Side-Lincoln Square (25), Upper West Side (Central) (24), and Hamilton Heights-Sugar Hill (18).
- 118 speed-camera tickets citywide in 12 monthsNY MAB9438 · 2019 Red Mercedes-Benz CoupeCaught here 5 times in the last 12 months.Typically speeds citywide in: Upper West Side (Central) (21), Upper West Side-Lincoln Square (14), and Financial District-Battery Park City (13).
- 108 speed-camera tickets citywide in 12 monthsNY LPK1735 · 2021 White Lambo SuburbanCaught here 1 time in the last 12 months.Typically speeds citywide in: Bay Ridge (5), East New York-New Lots (4), and Chelsea-Hudson Yards (4).
- 90 speed-camera tickets citywide in 12 monthsGA SKL4509 · 2018 Red Volkswagen 4SCaught here 1 time in the last 12 months.Typically speeds citywide in: Tremont (10), Forest Park (9), and Richmond Hill (7).
About this list
This ranks vehicles caught speeding in this area during the latest 12-month window by the number of NYC school-zone speed-camera violations they received anywhere in the city during that same window.
Camera violations are issued by NYC DOT’s program. Counts reflect issued tickets and may omit dismissed or pending cases. Plate text is shown verbatim as recorded.
CloseDangerous Schools in AD 71 Loading school hotspots...
| School | Crashes
Injuries
Child injuries
Deaths |
|---|
Dangerous Streets in AD 71 Loading street hotspots...
| Street | Crashes
Injuries
Child injuries
Deaths |
|---|
Dangerous Intersections in AD 71 Loading intersection hotspots...
| Intersection | Crashes
Injuries
Child injuries
Deaths |
|---|
Crash Finder
Try Crash Finder
Look up any street, school, address, or intersection to see how safe the streets are.
AD 71 Hot Spots Danger zones and recent crashes
Traffic Safety Timeline Tap to view recent events
Carnage in AD 71 5 Whiplash (Neck)
▸ Killed 3
▸ Severe Bleeding 1
▸ Severe Lacerations 2
▸ Concussion 1
▸ Fracture/Dislocation 2
▸ Internal Injury 3
▸ Whiplash 12
▸ Contusion/Bruise 13
▸ Abrasion 6
▸ Pain/Nausea 7
Crashes by Hour in AD 71 3 PM • 19 injuries ↑138%
Who is getting hurt? Kids 22 injuries ↑57% Seniors 18 injuries ↑12%
Toggle on at least one mode to see people totals.
Totals count people injured or killed. Use the mode filters above to focus the stacks.
Dangerous Bike Lanes in AD 71 Loading bike lane hotspots...
| Bike lane | Crashes
Cyclist injuries
Child injuries
Cyclist deaths |
|---|
What Crashes Cost Here Loading estimate...
Loading crash cost estimate...
The three blocks below show direct costs, other harm, and the total for crashes with injuries, crashes without injuries, and all crashes together.
How we calculate this
We calculate these costs using a method developed by the National Highway Traffic Safety Administration, or NHTSA. It gives one set of costs for crashes with injuries and another for crashes with no reported injuries.
Crashes with injuries cost much more because the method includes things like lost work, medical care, and long-term harm. NHTSA says crash costs include "lost productivity, medical, legal and court costs, emergency service, insurance administration, congestion, property damage, and workplace losses."
These are estimates, not bills. "Other harm" is the part of the broader estimate that goes beyond direct bills and insurance claims. It captures pain, disability, and lost quality of life.
Download the math (CSV) · Download the math (JSON) · Method and sources
Preventable Speeding 271 16+ offenders ↓76%
Repeat School-Zone Speeding Offenders
- ≥ 6: 820 (2026 year-to-date) • Prev: 3,091 2025 year-to-date
- ≥ 16: 271 (2026 year-to-date) • Prev: 1,137 2025 year-to-date
Pedestrian Injuries 98% by Cars and Trucks ↓2.5%
About this chart
We group pedestrian injuries and deaths by the vehicle type that struck them (as recorded in police reports). Use the year selector to compare the current window with the prior period.
- Trucks/Buses, SUVs/Cars, Mopeds, and Bikes reflect the broad categories we use to track vehicle harm.
- Counts include people on foot only; crashes with no injured pedestrians do not appear in this card.
Notes: Police classification can change during investigations. Small categories may have year-to-year variance.
CloseAssembly Member Al Taylor F (50)*
District 71
- 2022-06-02 · Vote · Open States · ↑ helps gradeSenate passed S 5602 to keep school zone speed cameras running longer. More eyes on reckless drivers. Lawmakers push back against speeding near kids. The vote was clear. The danger remains.
- 2022-05-31 · Vote · Open States · ↓ hurts gradeAssembly and Senate passed A 8933. The bill shields emergency vehicle operators from fines for traffic violations during medical calls. Vulnerable road users face more risk. Accountability weakens. Streets grow more dangerous.
- 2022-05-31 · Vote · Open States · ↓ hurts gradeAssembly and Senate passed A 8933. The bill shields emergency vehicle operators from fines for traffic violations during medical calls. Vulnerable road users face more risk. Accountability weakens. Streets grow more dangerous.
- 2022-05-25 · Vote · Open States · ↑ helps gradeSenate passed S 5602 to keep school zone speed cameras running longer. More eyes on reckless drivers. Lawmakers push back against speeding near kids. The vote was clear. The danger remains.
- 2022-05-31 · Vote · Open States · ↓ hurts gradeAssembly and Senate passed A 8933. The bill shields emergency vehicle operators from fines for traffic violations during medical calls. Vulnerable road users face more risk. Accountability weakens. Streets grow more dangerous.
- 2022-05-31 · Vote · Open States · ↓ hurts gradeAssembly and Senate passed A 8933. The bill shields emergency vehicle operators from fines for traffic violations during medical calls. Vulnerable road users face more risk. Accountability weakens. Streets grow more dangerous.
- 2022-05-25 · Vote · Open States · ↑ helps gradeSenate passed S 5602 to keep school zone speed cameras running longer. More eyes on reckless drivers. Lawmakers push back against speeding near kids. The vote was clear. The danger remains.
- 2022-05-23 · Vote · Open States · ↑ helps gradeSenate and Assembly passed S 1078. New drivers must now learn how to avoid hitting people on foot or bike. Law aims to cut crashes at the root—before drivers get the keys.
- 2023-06-20 · Leadership · Streetsblog NYC · ↑ helps gradeAssembly Member Inez Dickens stands firm against Sammy’s Law, lower speed limits, and more bike lanes in Harlem. She rejects congestion pricing, bus upgrades, and traffic calming. Her stance leaves vulnerable road users exposed. Other candidates back safety. Dickens does not.
- 2023-06-07 · Leadership · Streetsblog NYCMothers starve for Sammy’s Law. Hochul offers sympathy, not action. Heastie keeps the bill off the floor. The law would let New York City lower speed limits. Assembly support grows. Vulnerable road users wait. Streets stay deadly. Lawmakers stall. Lives hang in the balance.
- 2023-06-06 · Vote · Open States · ↑ helps gradeAlbany gets speed cameras near schools. Lawmakers pass A 7043. Cameras catch drivers who endanger kids. The program runs until 2028. Streets near schools face new watchful eyes.
- 2023-06-06 · Vote · Open States · ↑ helps gradeAlbany gets speed cameras near schools. Lawmakers pass A 7043. Cameras catch drivers who endanger kids. The program runs until 2028. Streets near schools face new watchful eyes.
- 2023-03-22 · Sponsor · Open States · ↑ helps gradeTaylor co-sponsors sustainable communities fund bill, no safety impact.
- 2023-02-13 · Vote · Open States · ↑ helps gradeAssembly and Senate passed A 602. The bill sets state funding rules for federally assisted and municipal complete street projects. Lawmakers moved fast. Streets shaped by budgets, not safety.
- 2023-01-24 · Vote · Open States · ↑ helps gradeAssembly and Senate passed A 602. The bill sets state funding rules for federally assisted and municipal complete street projects. Lawmakers moved fast. Streets shaped by budgets, not safety.
- 2023-01-13 · Sponsor · Open States · ↑ helps gradeAssembly bill A 1280 pushes for streets built for all. Dozens of lawmakers back the plan. The bill demands roads that protect walkers, cyclists, and riders. It calls for design, not luck, to keep people safe.
- 2024-06-07 · Vote · Open States · ↑ helps gradeAssembly passes A 7652. Schenectady gets school speed cameras. Law aims to slow drivers near kids. Cameras expire in 2028. Vote split. Streets may get safer for children on foot.
- 2024-06-07 · Vote · Open States · ↑ helps gradeAssembly passes A 7652. Schenectady gets school speed cameras. Law aims to slow drivers near kids. Cameras expire in 2028. Vote split. Streets may get safer for children on foot.
- 2024-06-07 · Vote · Open States · ↑ helps gradeLawmakers back speed cameras near Kingston schools. Cameras catch drivers who speed. The bill passed both chambers. It sunsets in 2029. Children and families walk safer, but the fix is temporary.
- 2024-06-06 · Vote · Open States · ↑ helps gradeLawmakers back speed cameras near Kingston schools. Cameras catch drivers who speed. The bill passed both chambers. It sunsets in 2029. Children and families walk safer, but the fix is temporary.
- 2024-04-18 · Vote · Open States · ↑ helps gradeTaylor votes yes on transportation budget bill with no safety impact.
- 2024-04-18 · Vote · Open States · ↑ helps gradeTaylor votes yes on transportation budget bill with no safety impact.
- 2024-04-02 · Vote · Open States · ↑ helps gradeTaylor votes yes to require recall checks before used car sales.
- 2025-06-17 · Vote · Open States · ↑ helps gradeSenate passes S 8344. School speed zone rules in New York City get extended. Lawmakers make technical fixes. The bill keeps pressure on drivers near schools. Streets stay a little safer for kids.
- 2025-06-16 · Vote · Open States · ↓ hurts gradeSenate passed S 7785. The bill carves out large Mitchell-Lama housing from bus traffic rules. Lawmakers voted yes. The carve-out weakens enforcement. Streets grow less safe for people on foot and bike.
- 2025-06-16 · Vote · Open States · ↑ helps gradeWhite Plains gets speed cameras near schools. Lawmakers move fast. Most vote yes. Cameras catch drivers who endanger kids. Program ends 2030. Streets may slow. Danger faces children every day.
- 2025-06-13 · Vote · Open StatesSenate and Assembly clear S 6815. MTA workers get a pass for driving in bus lanes while on duty. Law shields agency vehicles from tickets. Streets grow more crowded. Vulnerable users face more risk.
- 2025-05-07 · Vote · Open States · ↑ helps gradeTaylor votes yes on transportation budget bill with no safety impact.
- 2025-05-07 · Vote · Open States · ↑ helps gradeTaylor votes yes on transportation budget bill with no safety impact.
- 2025-01-16 · Sponsor · Open States · ↑ helps gradeAssembly bill A 2299 targets reckless drivers. Eleven points or six camera tickets in a year triggers forced speed control tech. Lawmakers move to curb repeat speeders. Streets demand fewer deadly risks.
- 2025-01-14 · Sponsor · Open States · ↑ helps gradeTaylor co-sponsors sustainable communities fund bill, no safety impact.
- 2026-01-30 · Sponsor · Open StatesTaylor co-sponsors climate and community investment act, with no safety impact.
- 2026-01-14 · Sponsor · Open States · ↓ hurts gradeTaylor sponsors carve‑out bill weakening bus traffic enforcement rules
- 2026-01-30 · Sponsor · Open StatesTaylor co-sponsors climate and community investment act, with no safety impact.
- 2026-01-14 · Sponsor · Open States · ↓ hurts gradeTaylor sponsors carve‑out bill weakening bus traffic enforcement rules
- 2025-06-17 · Vote · Open States · ↑ helps gradeSenate passes S 8344. School speed zone rules in New York City get extended. Lawmakers make technical fixes. The bill keeps pressure on drivers near schools. Streets stay a little safer for kids.
- 2025-06-16 · Vote · Open States · ↓ hurts gradeSenate passed S 7785. The bill carves out large Mitchell-Lama housing from bus traffic rules. Lawmakers voted yes. The carve-out weakens enforcement. Streets grow less safe for people on foot and bike.
2541-55 Adam Clayton Powell Jr. Blvd., New York, NY 10039
212-234-1430
Room 602, Legislative Office Building, Albany, NY 12248
518-455-5491
Council Member Carmen N. De La Rosa A (95)*

District 10
- 2024-12-19 · Sponsor · NYC Council – Legistar · ↑ helps gradeCouncil moves to test bold pavement markings at crash sites. Five spots per borough. Focus: places where drivers have killed or maimed. Report to follow. Streets marked for danger.
- 2024-12-19 · Vote · NYC Council – Legistar · ↓ hurts gradeDe La Rosa votes yes on bill requiring FDNY consultation for street projects.
- 2024-12-19 · Vote · NYC Council – Legistar · ↓ hurts gradeDe La Rosa votes yes on bill requiring FDNY consultation for street projects.
- 2024-12-05 · Sponsor · NYC Council – Legistar · ↑ helps gradeCouncil bill bars cars from blocking crosswalks. No standing or parking within 20 feet. City must install daylighting barriers at 1,000 intersections yearly. Streets clear. Sightlines open. Danger cut.
- 2024-04-18 · Sponsor · NYC Council – LegistarCouncil moves to hike fines for illegal ATVs and dirt bikes. First offense: $375–$750. Repeat: $750–$1,500. Law aims at reckless riders who menace city streets and endanger lives.
- 2024-03-07 · Sponsor · NYC Council – LegistarCouncil moves to force DOT to post clear bus lane signs on every block. Riders and walkers need to know when cars must stay out. The bill demands public, block-by-block rules. No more guessing. Streets reveal their rules.
- 2024-03-07 · Sponsor · NYC Council – Legistar · ↑ helps gradeDe La Rosa co-sponsors resolution for unlimited subway and bus transfers.
- 2024-02-28 · Sponsor · NYC Council – Legistar · ↑ helps gradeCouncil bill orders speed humps on roads beside parks over one acre. DOT can skip spots if safety or rules demand. Law aims to slow cars where families walk, run, and play.
- 2025-11-25 · Sponsor · NYC Council – LegistarCouncil orders DOT to study Harlem River ferry growth. West Bronx in focus. Report due in a year. Transit gaps choke streets; ferries could shift trips off deadly roads.
- 2025-11-25 · Sponsor · NYC Council – LegistarInt 1492 orders a one-year feasibility study to expand ferry service along the Harlem River, with focus on the West Bronx. It will map sites, costs, and navigational hurdles. The study itself changes no streets; future impacts on walkers and cyclists depend on design.
- 2025-11-25 · Sponsor · NYC Council – LegistarDe La Rosa co-sponsors Inwood ferry feasibility study, neutral safety impact.
- 2025-11-25 · Sponsor · NYC Council – LegistarDe La Rosa co-sponsors Inwood ferry feasibility study and report bill.
- 2025-05-02 · Leadership · Streetsblog NYC · ↑ helps gradeCouncil rallied for delivery workers. Many stayed home, fearing deportation. Instacart workers, mostly immigrants, remain excluded from wage protections. Council Member De La Rosa demanded equity. The law’s loophole leaves workers exposed, underpaid, and afraid. The fight for fair pay continues.
- 2025-05-02 · Leadership · Streetsblog NYC · ↑ helps gradeMay Day. Streets empty. Delivery workers vanish, scared of deportation. Supporters shout for fair pay. Instacart loophole leaves many unprotected. City’s most vulnerable stay home. Their silence deepens danger. Systemic risks linger. Equity denied. Safety lost.
- 2025-05-01 · Vote · NYC Council – LegistarCouncil passes law. Taxis and for-hire cars must post bold warnings on rear doors. Riders face the message: look for cyclists before swinging the door. A move to cut dooring. City acts. Cyclists stay in the crosshairs.
- 2025-05-01 · Vote · NYC Council – LegistarCouncil passes law. Taxis and for-hire cars must post bold warnings on rear doors. Riders face the message: look for cyclists before swinging the door. A move to cut dooring. City acts. Cyclists stay in the crosshairs.
- 2026-02-12 · Leadership · NYC Council – Legistar · ↑ helps gradeInt 0528-2026 moved to Public Safety committee. It hikes penalties for illegal ATVs and dirt bikes. The city targets repeat riding with steeper dollar hits.
- 2026-02-12 · Leadership · NYC Council – Legistar · ↑ helps gradeInt 0528-2026 moved to Public Safety committee. It hikes penalties for illegal ATVs and dirt bikes. The city targets repeat riding with steeper dollar hits.
- 2026-02-12 · Sponsor · NYC Council – Legistar · ↑ helps gradeInt 0528-2026 moved to Public Safety committee. It hikes penalties for illegal ATVs and dirt bikes. The city targets repeat riding with steeper dollar hits.
- 2026-02-12 · Sponsor · NYC Council – Legistar · ↑ helps gradeInt 0528-2026 targets illegal ATVs and dirt bikes with higher fines. It was introduced Feb. 12, 2026 and sent to the Public Safety Committee.
- 2026-02-12 · Leadership · NYC Council – Legistar · ↑ helps gradeInt 0528-2026 moved to Public Safety committee. It hikes penalties for illegal ATVs and dirt bikes. The city targets repeat riding with steeper dollar hits.
- 2026-02-12 · Leadership · NYC Council – Legistar · ↑ helps gradeInt 0528-2026 moved to Public Safety committee. It hikes penalties for illegal ATVs and dirt bikes. The city targets repeat riding with steeper dollar hits.
- 2026-02-12 · Sponsor · NYC Council – Legistar · ↑ helps gradeInt 0528-2026 moved to Public Safety committee. It hikes penalties for illegal ATVs and dirt bikes. The city targets repeat riding with steeper dollar hits.
- 2026-02-12 · Sponsor · NYC Council – Legistar · ↑ helps gradeInt 0528-2026 targets illegal ATVs and dirt bikes with higher fines. It was introduced Feb. 12, 2026 and sent to the Public Safety Committee.
618 W. 177th Street, Ground Floor, New York, NY 10033
917-521-2616
250 Broadway, Suite 1880, New York, NY 10007
212-788-7053
Other Geographies See nearby areas
▸ Other Geographies
AD 71 Assembly District 71 sits in Manhattan, District 10, Precinct 33.
It contains Manhattan CB 9, Manhattan CB 12, Hamilton Heights-Sugar Hill, Harlem (North), Washington Heights (South), Washington Heights (North), Inwood Hill Park.
▸ See also
