Assembly District 74
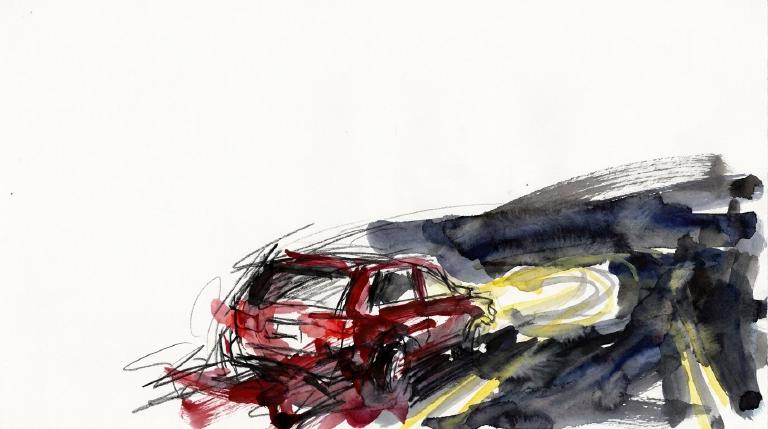
Crash Narratives
Assembly District 74: Traffic Crash Statistics
Crash Counter for AD 74 387 crashes • 3 deaths
About these crash totals
Counts come from NYC police crash reports (NYPD Motor Vehicle Collisions on NYC Open Data). We sum all crashes, injuries, and deaths for this area across the selected time window shown on the card. Injury severity follows DOT's KABCO definitions mapped from the NYPD Person table (injury status, injury type, and injury location).
- Crashes: number of police‑reported collisions (all road users).
- All injuries: people with any reported injury (KABCO A/B/C or generic "injured").
- Moderate / Serious: suspected minor + suspected serious injuries (KABCO B + A).
- Deaths: killed or apparent death reported by police (KABCO K).
Change badges (arrows and percentages) compare the selected window with the same period last year whenever we have enough history. The “From 2022” view shows totals across the full span since 2022. When a comparison window isn’t available the badge shows an em dash.
Notes: Police reports can be corrected after initial publication. We cannot verify "death within 30 days" or hospital outcomes, so small differences from DOT totals are possible. Minor incidents without a police report are not included.
CloseCaught Speeding in AD 74 SGY7043 — 184 times
- 184 speed-camera tickets citywide in 12 monthsGA SGY7043 · 2021 White Mercedes-Benz 4SCaught here 1 time in the last 12 months.Typically speeds citywide in: Canarsie (50), Sheepshead Bay-Manhattan Beach-Gerritsen Beach (19), and Baisley Park (16).
- 178 speed-camera tickets citywide in 12 monthsPA KZC2999 · 2019 Nissan SedanCaught here 1 time in the last 12 months.Typically speeds citywide in: Flatbush (West)-Ditmas Park-Parkville (13), Bensonhurst (11), and East Flatbush-Rugby (10).
- 160 speed-camera tickets citywide in 12 monthsNY KXH2766 · 2022 Gray Kia SedanCaught here 1 time in the last 12 months.Typically speeds citywide in: Tompkinsville-Stapleton-Clifton-Fox Hills (36), Mariner's Harbor-Arlington-Graniteville (29), and West New Brighton-Silver Lake-Grymes Hill (15).
- 125 speed-camera tickets citywide in 12 monthsNY LHW6587 · 2024 Gray Subaru SuburbanCaught here 2 times in the last 12 months.Typically speeds citywide in: Crown Heights (North) (12), Bedford-Stuyvesant (West) (7), and Fort Greene (5).
- 124 speed-camera tickets citywide in 12 monthsNY KJK3063 · 2024 Black Cadillac SuburbanCaught here 1 time in the last 12 months.Typically speeds citywide in: Port Richmond (32), Mariner's Harbor-Arlington-Graniteville (11), and Arden Heights-Rossville (10).
About this list
This ranks vehicles caught speeding in this area during the latest 12-month window by the number of NYC school-zone speed-camera violations they received anywhere in the city during that same window.
Camera violations are issued by NYC DOT’s program. Counts reflect issued tickets and may omit dismissed or pending cases. Plate text is shown verbatim as recorded.
CloseDangerous Schools in AD 74 Loading school hotspots...
| School | Crashes
Injuries
Child injuries
Deaths |
|---|
Dangerous Streets in AD 74 Loading street hotspots...
| Street | Crashes
Injuries
Child injuries
Deaths |
|---|
Dangerous Intersections in AD 74 Loading intersection hotspots...
| Intersection | Crashes
Injuries
Child injuries
Deaths |
|---|
Crash Finder
Try Crash Finder
Look up any street, school, address, or intersection to see how safe the streets are.
AD 74 Hot Spots Danger zones and recent crashes
Traffic Safety Timeline Tap to view recent events
Carnage in AD 74 10 Abrasion (Lower leg/foot)
▸ Killed 3
▸ Crush Injuries 1
▸ Severe Lacerations 1
▸ Concussion 2
▸ Fracture/Dislocation 4
▸ Internal Injury 2
▸ Whiplash 8
▸ Contusion/Bruise 13
▸ Abrasion 22
▸ Pain/Nausea 9
Crashes by Hour in AD 74 8 PM • 16 injuries ↑78%
Who is getting hurt? Kids 7 injuries ↓50% Seniors 13 injuries ↓28%
Toggle on at least one mode to see people totals.
Totals count people injured or killed. Use the mode filters above to focus the stacks.
Dangerous Bike Lanes in AD 74 Loading bike lane hotspots...
| Bike lane | Crashes
Cyclist injuries
Child injuries
Cyclist deaths |
|---|
What Crashes Cost Here Loading estimate...
Loading crash cost estimate...
The three blocks below show direct costs, other harm, and the total for crashes with injuries, crashes without injuries, and all crashes together.
How we calculate this
We calculate these costs using a method developed by the National Highway Traffic Safety Administration, or NHTSA. It gives one set of costs for crashes with injuries and another for crashes with no reported injuries.
Crashes with injuries cost much more because the method includes things like lost work, medical care, and long-term harm. NHTSA says crash costs include "lost productivity, medical, legal and court costs, emergency service, insurance administration, congestion, property damage, and workplace losses."
These are estimates, not bills. "Other harm" is the part of the broader estimate that goes beyond direct bills and insurance claims. It captures pain, disability, and lost quality of life.
Download the math (CSV) · Download the math (JSON) · Method and sources
Preventable Speeding 526 16+ offenders ↓72%
Repeat School-Zone Speeding Offenders
- ≥ 6: 1,372 (2026 year-to-date) • Prev: 4,586 2025 year-to-date
- ≥ 16: 526 (2026 year-to-date) • Prev: 1,857 2025 year-to-date
Pedestrian Injuries 98% by Cars and Trucks ↑17%
About this chart
We group pedestrian injuries and deaths by the vehicle type that struck them (as recorded in police reports). Use the year selector to compare the current window with the prior period.
- Trucks/Buses, SUVs/Cars, Mopeds, and Bikes reflect the broad categories we use to track vehicle harm.
- Counts include people on foot only; crashes with no injured pedestrians do not appear in this card.
Notes: Police classification can change during investigations. Small categories may have year-to-year variance.
CloseAssembly Member Keith Powers F (50)*
Assembly Member Keith Powers
District 74
107 and 109 Avenue B, New York, NY 10009
212-979-9696
Room 432, Legislative Office Building, Albany, NY 12248
518-455-5506
Council Member Virginia Maloney F (2)

District 4
- 2026-04-30 · Leadership · AMNY · ↓ hurts gradeA new Council bill would lock e-bikes to 15 mph. It aims to curb pedestrian injuries. Critics warn it targets riders, not cars, and could fuel uneven enforcement.
- 2026-04-30 · Sponsor · NYC Council – Legistar · ↓ hurts gradeA new Council bill would set a 15 mph e-bike speed limit. Riders over the cap could face a civil penalty up to $50. The measure now sits in the Transportation and Infrastructure Committee.
- 2026-04-30 · Sponsor · NYC Council – Legistar · ↓ hurts gradeInt 0876-2026 landed in committee. It sets a 15 mph e-bike cap. It adds up to $50 in civil penalties.
- 2026-04-16 · Sponsor · NYC Council – LegistarMaloney primarily sponsors Willets Point ferry service administrative code changes.
211 East 43rd Street, Suite 1205, New York, NY 10017
212-818-0580
250 Broadway, Suite 1725, New York, NY 10007
212-788-7393
Other Geographies See nearby areas
▸ Other Geographies
AD 74 Assembly District 74 sits in Manhattan, District 4, Precinct 13.
It contains Manhattan CB 3, Manhattan CB 6, East Village, Stuyvesant Town-Peter Cooper Village, Gramercy, Murray Hill-Kips Bay, United Nations.
▸ See also
