Brooklyn Community Board 1
Crash Narratives
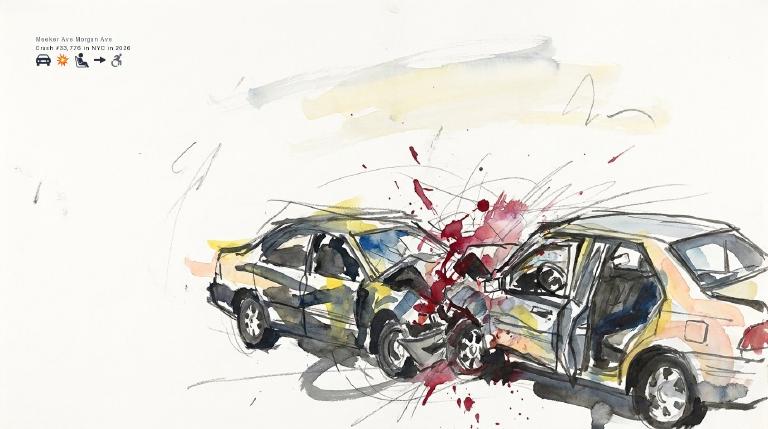
Brooklyn CB 1 turns loud with three serious injuries in one week
May 21 to May 28 saw 3 crashes and 3 serious injuries in Brooklyn CB 1. A left turn on Grand Street crushed a moped rider’s leg and foot.
Brooklyn CB 1 is normally quiet. It turned loud from May 21 to May 28. There were 3 crashes. There were 3 serious injuries.
One crash came after dark near 629 Grand Street. A driver turned left into a 23 year old moped rider. The rider reported crush injuries to a leg and foot. Two more people were badly hurt on the BQE. This area has fired 7 times in 90 days and 7 times in 365 days. Community Board Contact Dealice Fuller should push for hard turn calming and daylighting on Grand Street and for safety fixes on BQE approaches.
- 3 crashes in last 7 days
- 3 serious injuries
- A driver making a left turn hit a 23-year-old moped rider near 629 Grand Street after dark. The rider reported crush injuries to a leg and foot.
- Police recorded driver inattention on the BQE after midnight. A 64-year-old passenger suffered a concussion, and a 56-year-old rear-seat passenger reported neck pain and nausea.
- A driver on the Brooklyn-Queens Expressway followed too closely and crashed. The 35-year-old driver reported crush injuries to her knee and lower leg.
Driver blew traffic control, hit cyclist
A driver in a sedan disregarded traffic control and hit a 26-year-old cyclist on Roebling Street near N 4th Street. The rider suffered a head injury with severe bleeding.
Brooklyn Community Board 1: Traffic Crash Statistics
Crash Counter for Brooklyn CB1 969 crashes • 2 deaths
About these crash totals
Counts come from NYC police crash reports (NYPD Motor Vehicle Collisions on NYC Open Data). We sum all crashes, injuries, and deaths for this area across the selected time window shown on the card. Injury severity follows DOT's KABCO definitions mapped from the NYPD Person table (injury status, injury type, and injury location).
- Crashes: number of police‑reported collisions (all road users).
- All injuries: people with any reported injury (KABCO A/B/C or generic "injured").
- Moderate / Serious: suspected minor + suspected serious injuries (KABCO B + A).
- Deaths: killed or apparent death reported by police (KABCO K).
Change badges (arrows and percentages) compare the selected window with the same period last year whenever we have enough history. The “From 2022” view shows totals across the full span since 2022. When a comparison window isn’t available the badge shows an em dash.
Notes: Police reports can be corrected after initial publication. We cannot verify "death within 30 days" or hospital outcomes, so small differences from DOT totals are possible. Minor incidents without a police report are not included.
CloseCaught Speeding in CB 301 KZF9054 — 182 times
- 182 speed-camera tickets citywide in 12 monthsNY KZF9054 · 2023 Black Mitsubishi SuburbanCaught here 1 time in the last 12 months.Typically speeds citywide in: East New York-New Lots (12), Crown Heights (North) (10), and Bedford Park (9).
- 178 speed-camera tickets citywide in 12 monthsPA KZC2999 · 2019 Nissan SedanCaught here 1 time in the last 12 months.Typically speeds citywide in: Flatbush (West)-Ditmas Park-Parkville (13), Bensonhurst (11), and East Flatbush-Rugby (10).
- 177 speed-camera tickets citywide in 12 monthsNY LVP1921 · 2022 Gray Chevrolet SedanCaught here 1 time in the last 12 months.Typically speeds citywide in: Breezy Point-Belle Harbor-Rockaway Park-Broad Channel (36), South Ozone Park (14), and Soundview-Clason Point (12).
- 164 speed-camera tickets citywide in 12 monthsNY LHW6019 · 2024 Gray Toyota SedanCaught here 2 times in the last 12 months.Typically speeds citywide in: Crown Heights (North) (13), East New York-New Lots (8), and Ocean Hill (8).
- 159 speed-camera tickets citywide in 12 monthsNY LTJ3931 · 2022 Whbk Mercedes-Benz SuburbanCaught here 1 time in the last 12 months.Typically speeds citywide in: Upper West Side-Lincoln Square (25), Upper West Side (Central) (24), and Hamilton Heights-Sugar Hill (18).
About this list
This ranks vehicles caught speeding in this area during the latest 12-month window by the number of NYC school-zone speed-camera violations they received anywhere in the city during that same window.
Camera violations are issued by NYC DOT’s program. Counts reflect issued tickets and may omit dismissed or pending cases. Plate text is shown verbatim as recorded.
CloseDangerous Schools in CB 301 Loading school hotspots...
| School | Crashes
Injuries
Child injuries
Deaths |
|---|
Dangerous Streets in CB 301 Loading street hotspots...
| Street | Crashes
Injuries
Child injuries
Deaths |
|---|
Dangerous Intersections in CB 301 Loading intersection hotspots...
| Intersection | Crashes
Injuries
Child injuries
Deaths |
|---|
Crash Finder
Try Crash Finder
Look up any street, school, address, or intersection to see how safe the streets are.
CB 301 Hot Spots Danger zones and recent crashes
Traffic Safety Timeline Tap to view recent events
Carnage in CB 301 10 Whiplash (Back)
▸ Killed 2
▸ Crush Injuries 3
▸ Severe Bleeding 5
▸ Severe Lacerations 1
▸ Concussion 3
▸ Fracture/Dislocation 7
▸ Internal Injury 6
▸ Whiplash 27
▸ Contusion/Bruise 26
▸ Abrasion 10
▸ Pain/Nausea 16
Crashes by Hour in CB 301 5 PM • 46 injuries ↑92%
Who is getting hurt? Kids 26 injuries ↑13% Seniors 22 injuries ↑10%
Toggle on at least one mode to see people totals.
Totals count people injured or killed. Use the mode filters above to focus the stacks.
Dangerous Bike Lanes in CB 301 Loading bike lane hotspots...
| Bike lane | Crashes
Cyclist injuries
Child injuries
Cyclist deaths |
|---|
What Crashes Cost Here Loading estimate...
Loading crash cost estimate...
The three blocks below show direct costs, other harm, and the total for crashes with injuries, crashes without injuries, and all crashes together.
How we calculate this
We calculate these costs using a method developed by the National Highway Traffic Safety Administration, or NHTSA. It gives one set of costs for crashes with injuries and another for crashes with no reported injuries.
Crashes with injuries cost much more because the method includes things like lost work, medical care, and long-term harm. NHTSA says crash costs include "lost productivity, medical, legal and court costs, emergency service, insurance administration, congestion, property damage, and workplace losses."
These are estimates, not bills. "Other harm" is the part of the broader estimate that goes beyond direct bills and insurance claims. It captures pain, disability, and lost quality of life.
Download the math (CSV) · Download the math (JSON) · Method and sources
Preventable Speeding 625 16+ offenders ↓72%
Repeat School-Zone Speeding Offenders
- ≥ 6: 1,744 (2026 year-to-date) • Prev: 5,733 2025 year-to-date
- ≥ 16: 625 (2026 year-to-date) • Prev: 2,238 2025 year-to-date
Pedestrian Injuries 92% by Cars and Trucks ↑19%
About this chart
We group pedestrian injuries and deaths by the vehicle type that struck them (as recorded in police reports). Use the year selector to compare the current window with the prior period.
- Trucks/Buses, SUVs/Cars, Mopeds, and Bikes reflect the broad categories we use to track vehicle harm.
- Counts include people on foot only; crashes with no injured pedestrians do not appear in this card.
Notes: Police classification can change during investigations. Small categories may have year-to-year variance.
CloseCommunity Board Contact Dealice Fuller —
Community Board Contact Dealice Fuller
District 301
Assembly Member Emily Gallagher B (79)
District 50
- 2022-11-17 · Leadership · Streetsblog NYC · ↑ helps gradeLawmakers and advocates rallied in Manhattan. They demanded more money for the MTA. They want six-minute bus and subway service. They warned against service cuts and fare hikes. They called for gas tax revenue to fund transit. Riders need safe, frequent service.
- 2022-08-31 · Leadership · Streetsblog NYC · ↑ helps gradeDOT will daylight intersections, ban left turns, and add pedestrian space on McGuinness Boulevard. Eleven pedestrians and four cyclists have died here since 1995. Advocates demand a full redesign. The city promises more action after these quick fixes.
- 2022-07-15 · Leadership · Streetsblog NYC · ↑ helps gradeGov. Hochul signed a law forcing new drivers to learn about pedestrian and cyclist safety. The law closes a deadly gap in driver education. Assemblymember Gallagher and Senator Gounardes led the push. The change targets inexperience behind the wheel. Lives are at stake.
- 2022-07-01 · Leadership · Streetsblog NYC · ↑ helps gradeCouncil Member Restler slammed DOT’s weak McGuinness Boulevard redesign. Three killed since 2014. Advocates want fewer lanes, safer crossings, protected bike lanes. DOT’s plans keep traffic flow, ignore calls for real change. Community demands safety, not parking.
- 2022-05-31 · Vote · Open States · ↓ hurts gradeAssembly and Senate passed A 8933. The bill shields emergency vehicle operators from fines for traffic violations during medical calls. Vulnerable road users face more risk. Accountability weakens. Streets grow more dangerous.
- 2022-05-31 · Vote · Open States · ↓ hurts gradeAssembly and Senate passed A 8933. The bill shields emergency vehicle operators from fines for traffic violations during medical calls. Vulnerable road users face more risk. Accountability weakens. Streets grow more dangerous.
- 2022-05-25 · Vote · Open States · ↑ helps gradeSenate passed S 5602 to keep school zone speed cameras running longer. More eyes on reckless drivers. Lawmakers push back against speeding near kids. The vote was clear. The danger remains.
- 2022-05-23 · Vote · Open States · ↑ helps gradeSenate and Assembly passed S 1078. New drivers must now learn how to avoid hitting people on foot or bike. Law aims to cut crashes at the root—before drivers get the keys.
- 2023-11-29 · Leadership · Streetsblog NYC · ↓ hurts gradeMayor Adams gutted the McGuinness Blvd. safety plan. Two lanes each way remain. Bike lanes go unprotected. Crossing distances stretch. Local leaders say nothing changed for people on foot. Cyclists dodge cars and illegal parking. The danger stays. The fight continues.
- 2023-09-12 · Leadership · crainsnewyork.com · ↓ hurts gradeCouncil Member Lincoln Restler stands against the city’s plan for bike lanes and a road diet on McGuinness Boulevard. He claims the redesign will push heavy traffic onto quiet side streets, risking more harm for pedestrians and families in Greenpoint.
- 👍 Positive2023-08-18 · Sponsor · Open States · ↑ helps gradeAssembly bill A 7979 targets reckless drivers. Eleven points or six camera tickets triggers a speed limiter. Lawmakers move to curb repeat danger. No more unchecked speeding. Streets demand it.
- 2023-08-16 · Leadership · Streetsblog NYC · ↑ helps gradeMayor Adams approved a diluted redesign for McGuinness Boulevard. Protected bike lanes will come, but car lanes stay open during peak hours. The plan falls short of full safety measures. The road remains dangerous. Victims still count. No one is satisfied.
- 2023-05-03 · Leadership · Streetsblog NYC · ↑ helps gradeCity will cut car lanes, add protected bike lanes, and shorten crosswalks on McGuinness Boulevard. The redesign follows deadly crashes and strong advocacy. Officials call it transformative. DOT claims similar changes cut deaths and injuries by 30 percent.
- 2023-03-03 · Leadership · Streetsblog NYC · ↓ hurts gradeCity Hall floats three-lane BQE. Electeds push back. Two lanes, they say, or fewer. Advocates want transit, not more highway. Officials call City Hall’s claims false. The fight is sharp. Vulnerable road users watch as cars and trucks rule the debate.
- 2023-02-21 · Leadership · Streetsblog NYC · ↑ helps gradeThe BQE slices through North Brooklyn, choking streets with noise and fumes. City leaders have tools to force state DOT to the table but hold back. Advocates demand Adams use his power. The highway’s shadow falls hardest on those walking and biking nearby.
- 2023-02-13 · Leadership · Streetsblog NYC · ↑ helps gradeDMV told New Yorkers to report defaced plates through official channels, not to the commissioner. Law enforcement, not the DMV, should ticket offenders. Critics say sending new plates lets reckless drivers dodge accountability. The city’s most vulnerable remain at risk.
- 2024-10-02 · Leadership · Streetsblog NYC · ↑ helps gradeCity will cut McGuinness Boulevard from four lanes to two. DOT reversed course after backlash. Advocates and Assembly Member Gallagher cheered the move. Fewer lanes mean slower cars, fewer crashes. The fight for safety on the rest of the boulevard continues.
- 2024-08-26 · Leadership · Streetsblog NYC · ↓ hurts gradeMayor Adams caved to business pressure, gutting a proven safety redesign for McGuinness Boulevard. The city scrapped lane reductions and protected bike lanes. Pedestrians and cyclists remain exposed. Elected officials condemned the move. The mayor put politics before lives.
- 2024-06-28 · Leadership · Streetsblog NYC · ↑ helps gradePro-safety candidates swept North Brooklyn primaries. Voters backed the McGuinness Boulevard redesign. Opponents, funded by Broadway Stages, lost every race. Assemblymember Gallagher called for Mayor Adams to finish the job. The city’s delay keeps the boulevard deadly for walkers and riders.
- 2024-06-28 · Leadership · gothamist.com · ↑ helps gradeEmily Gallagher crushed her opponent. She stood with Greenpoint. She backed ripping out car lanes and building protected bike lanes on McGuinness Boulevard. The street is deadly. Locals cheered. The fight for safer streets just got muscle.
- 2024-04-18 · Vote · Open States · ↑ helps gradeGallagher votes yes on transportation budget bill with no safety impact.
- 2024-04-18 · Vote · Open States · ↑ helps gradeGallagher votes yes on transportation budget bill with no safety impact.
- 2024-04-02 · Vote · Open States · ↑ helps gradeGallagher votes yes to require recall checks before used car sales.
- 2024-02-27 · Leadership · brooklynpaper.com · ↑ helps gradeA truck killed Danielle Aber in a Greenpoint crosswalk. The driver had a record of speeding. Kristen Gonzalez demanded tougher laws for repeat offenders and urgent safety fixes on Nassau Avenue. Officials say policy failure and missing infrastructure left Aber exposed.
- 2025-08-29 · Leadership · City & State NYAssembly member Emily Gallagher chronicled McGuinness Boulevard. The road cuts through Greenpoint. She studied it for safety but offered no concrete policy. Hazards to pedestrians and cyclists are described but remain unaddressed.
- 2025-08-25 · Leadership · brooklynpaper.com · ↓ hurts gradeLocals rallied after indictments allege a mayoral aide took bribes to derail DOT’s McGuinness road diet. DOT had approved removing a vehicle lane for parking‑protected bike lanes. The compromise went through instead. Cyclists and pedestrians remain exposed. Activists demand the original redesign now.
- 2025-08-11 · Leadership · Brooklyn Paper · ↑ helps gradeA Freightliner truck killed a 56-year-old man crossing Morgan Avenue. Neighbors rallied at Cooper Park. They demand protected bike lanes, crosswalks, daylighting and enforcement. City has not redesigned the street. Four fatal incidents since 2022.
- 2025-08-07 · Leadership · Streetsblog NYC · ↑ helps gradeA pedestrian was killed on Morgan Avenue — the third in three years. Advocates call for protected bike lanes and mid-block crossings. Officials back the push. The city has not redesigned the street. Danger remains.
- 2025-05-22 · Leadership · Streetsblog NYC · ↑ helps gradeAmy Sohn left her car. She walked Albany’s streets. She saw the city with new eyes. She called car ownership a burden. She praised walkability. Her story shows what’s possible. But without new laws, streets stay the same.
- 2025-05-21 · Leadership · Streetsblog NYC · ↑ helps gradeSenate moves to clamp down on repeat speeders. Bill forces reckless drivers to install speed limiters. Lawmakers act after years of carnage. Streets remain perilous for walkers and riders until the law takes hold.
- 2025-05-13 · Leadership · Streetsblog NYC · ↓ hurts gradeSenate Republicans forced a vote on S533 to repeal congestion pricing. Democrats may let it advance with a hollow 'Aye Without Recommendation.' Meanwhile, the Idaho Stop bill, which could save cyclists’ lives, remains stalled. NYPD cracks down on riders. Cyclists keep dying.
- 2025-05-07 · Vote · Open States · ↑ helps gradeGallagher votes yes on transportation budget bill with no safety impact.
- 2026-05-27 · Leadership · Streetsblog Empire State · ↑ helps gradeAlbany made NYC target repeat school-zone speeders. After 16 camera hits in a year, drivers can be ordered to install speed governors. Skip it, and registration can be yanked. It aims at the worst speed that maims and kills.
- 2026-05-11 · Leadership · Streetsblog Empire State · ↑ helps gradeA plan targets drivers with 16 speed-camera tickets in 12 months. It would order a speed governor after the 16th hit. But the piece says weak rules and weak follow-through could leave repeat speeding on the street.
- 2026-05-07 · Leadership · Streetsblog Empire State · ↑ helps gradeA must-pass budget now carries the “Stop Super Speeders” plan. It targets repeat speed-camera violators for speed-limiting tech. The details are still in flux.
- 2026-05-05 · Leadership · Streetsblog Empire State · ↓ hurts gradeAlbany argued while danger stayed put. Speed-limiter plan for repeat speeders hit due-process and privacy pushback. The delay keeps fast cars in play for people on foot and on bikes.
685A Manhattan Ave., Brooklyn, NY 11222
718-383-7474
Room 441, Legislative Office Building, Albany, NY 12248
518-455-4477
Council Member Jennifer Gutiérrez A (100)

District 34
- 2024-12-19 · Vote · NYC Council – LegistarGutiérrez does not vote as Council passes bill with no safety impact.
- 2024-12-05 · Sponsor · NYC Council – Legistar · ↑ helps gradeCouncil bill bars cars from blocking crosswalks. No standing or parking within 20 feet. City must install daylighting barriers at 1,000 intersections yearly. Streets clear. Sightlines open. Danger cut.
- • Neutral2024-09-26 · Sponsor · NYC Council – LegistarCouncil bill slashes legal parking time for big rigs. Ninety minutes max for tractor-trailers. Three hours for other commercial trucks. Streets clear faster. Heavy metal moves on.
- 2024-09-26 · Vote · NYC Council – Legistar · ↑ helps gradeCouncil ends jaywalking penalties. Pedestrians now cross anywhere, any time. No summons. Law strips drivers of excuses. Streets shift. Power tilts to people on foot.
- 2024-05-16 · Sponsor · NYC Council – Legistar · ↑ helps gradeCouncil moves to light up step streets. At least 25 stairways each year will get new lamps. Dark paths become visible. Pedestrians gain ground. Shadows shrink. Danger loses its cover.
- 2024-04-18 · Sponsor · NYC Council – Legistar · ↑ helps gradeCouncil orders swift removal of abandoned and unplated cars. Streets clear in 72 hours. Police target vehicles with missing or fake plates. Fewer hazards for those on foot and bike.
- 2024-03-19 · Sponsor · NYC Council – Legistar · ↑ helps gradeCouncil bill orders DOT to repair broken curbs during street resurfacing. Hazardous curbs trip, trap, and injure. The fix is overdue. Pedestrians need solid ground. Council moves to force action.
- 2024-03-19 · Sponsor · NYC Council – LegistarCouncil wants bold signs at every school entrance. Paint on pavement. Metal overhead. The aim: warn drivers, shield kids. The bill sits in committee. Streets wait. Danger does not.
- 👍 Positive2025-08-14 · Sponsor · NYC Council – Legistar · ↑ helps gradeInt. 1353 orders the department to finish traffic calming or control devices on streets next to schools within 60 days of a study determination. The law takes effect immediately. Sponsors moved to speed protective infrastructure for children.
- 2025-08-14 · Sponsor · NYC Council – Legistar · ↑ helps gradeInt. 1353 forces DOT to install approved traffic calming or control devices on streets adjacent to schools within 60 days of a traffic study. Exempts major projects. Cuts delays that keep walkers and cyclists exposed to danger.
- Gutiérrez co-sponsors faster installation of school traffic safety devices, boosting overall safety.👍 Positive2025-08-14 · Sponsor · NYC Council – Legistar · ↑ helps gradeInt 1353-2025 forces DOT to install traffic calming on streets beside schools within 60 days of a study finding. It shortens long delays that leave crossings and bike lanes exposed. Major transportation projects are exempt.
- 2025-08-14 · Sponsor · NYC Council – Legistar · ↑ helps gradeInt 1353 forces DOT to install traffic calming by schools within 60 days of a study. Faster hardware cuts speeds and protects walkers and cyclists.
- 2025-05-28 · Sponsor · NYC Council – Legistar · ↑ helps gradeCouncil pushes a bill to cut bike share costs for New Yorkers over 65. The measure aims to open city cycling to more seniors. The committee now weighs its next move.
- 2025-05-28 · Sponsor · NYC Council – Legistar · ↑ helps gradeCouncil bill pushes for discounted bike share rates for New Yorkers 65 and up. The move aims to open city streets to older riders. The measure sits with the Transportation Committee. No safety review yet.
- 2025-05-01 · Vote · NYC Council – LegistarCouncil passes law. Taxis and for-hire cars must post bold warnings on rear doors. Riders face the message: look for cyclists before swinging the door. A move to cut dooring. City acts. Cyclists stay in the crosshairs.
- 2025-04-24 · Sponsor · NYC Council – Legistar · ↑ helps gradeCouncil pushes Albany to force speed limiters on chronic speeders. The move targets reckless drivers. Streets stay deadly while the bill sits in committee. Pedestrians and cyclists wait for action.
- 2026-04-30 · Sponsor · NYC Council – LegistarGutiérrez co-sponsors bill banning NYPD weaponized robots, safety impact unclear.
- 2026-03-10 · Sponsor · NYC Council – Legistar · ↑ helps gradeInt 0780-2026 targets NYPD speeding and crash secrecy. It orders daily public maps of where department vehicles speed and where they collide. The bill now sits in committee.
- 2026-03-10 · Sponsor · NYC Council – Legistar · ↑ helps gradePolice cars speed. People get hit. Int 0780-2026 would force NYPD to publish daily maps of where its vehicles exceeded limits and where moving department vehicles crashed, including when pedestrians were struck, hurt, or killed.
- 2026-02-24 · Sponsor · NYC Council – LegistarGutiérrez co-sponsors bill requiring police blood alcohol testing after shootings.
244 Union Avenue, Brooklyn, NY 11211
718-963-3141
250 Broadway, Suite 1747, New York, NY 10007
212-788-7095
State Senator Julia Salazar A (93)*

District 18
- 2022-08-30 · Leadership · streetsblog.org · ↑ helps gradeSenator Julia Salazar’s Ride Clean bill passed the New York Senate 60-3. It offers up to $1,100 for e-bike purchases. The bill aims to cut car use and emissions. It stalled in the Assembly. Lawmakers say it makes e-bikes accessible for working New Yorkers.
- 2022-08-30 · Leadership · Streetsblog NYC · ↑ helps gradeLawmakers push for e-bike rebates. Senate passes, Assembly stalls. Salazar and Carroll lead. Up to $1,100 for buyers. Critics call it a luxury. Carroll disagrees. Program aims for working-class riders. Cars keep killing. E-bikes offer a way out.
- 2022-06-01 · Vote · Open States · ↑ helps gradeAlbany passed A 8936. Cities get more state cash if they build complete streets. Lawmakers want safer roads. The bill sailed through both chambers. Money now follows safety.
- 2022-06-01 · Vote · Open States · ↓ hurts gradeAssembly and Senate passed A 8933. The bill shields emergency vehicle operators from fines for traffic violations during medical calls. Vulnerable road users face more risk. Accountability weakens. Streets grow more dangerous.
- 2022-06-01 · Vote · Open States · ↑ helps gradeSalazar votes yes in committee on ignition interlock monitor bill.
- 2022-06-01 · Vote · Open States · ↑ helps gradeSalazar votes yes in committee on ignition interlock monitor bill.
- 2023-08-04 · Leadership · brooklynpaper.com · ↑ helps gradeTwo bodies pulled from Newtown Creek. Council Member Gutiérrez demands action. Industrial zones draw crowds but lack lights, signs, transit. Politicians push for safety. Danger stalks dark streets. City must fix deadly gaps before more lives are lost.
- 2023-07-18 · Leadership · amny.com · ↑ helps gradeBrooklyn officials demand equal tolls on all Manhattan crossings. They warn free bridges funnel traffic into certain neighborhoods. Their letter calls for fairness. The MTA stays silent. The Traffic Mobility Review Board will decide. Streets hang in the balance.
- 2023-06-08 · Vote · Open States · ↑ helps gradeAlbany gets speed cameras near schools. Lawmakers pass A 7043. Cameras catch drivers who endanger kids. The program runs until 2028. Streets near schools face new watchful eyes.
- 2023-06-06 · Vote · Open States · ↑ helps gradeAlbany gets speed cameras near schools. Lawmakers pass A 7043. Cameras catch drivers who endanger kids. The program runs until 2028. Streets near schools face new watchful eyes.
- 2023-06-01 · Vote · Open States · ↑ helps gradeSenate passes S 6808. The bill creates first responder safety zones. It sets speed limits in these zones. Lawmakers act after crashes and close calls. The vote is strong. The danger is real. The streets demand change.
- 2023-05-31 · Vote · Open States · ↑ helps gradeSenate passes S 2714. Bill pushes complete street design. Aim: safer roads for all. Pedestrians, cyclists, and riders get space. Car dominance challenged. Lawmakers move to cut street carnage.
- 2023-05-16 · Vote · Open States · ↑ helps gradeSenate backs S 775. The bill defines the ignition interlock monitor’s job. It forces offenders to install devices and obey court orders. Lawmakers act to keep repeat drunk drivers off the street.
- 2023-05-10 · Vote · Open States · ↑ helps gradeSalazar votes yes to add reckless driving awareness to licensing courses.
- 2024-08-23 · Leadership · Streetsblog NYC · ↑ helps gradeLawmakers say Hochul broke the law. They filed a brief. They argue the governor has no right to halt congestion pricing. The MTA Board, not Albany, holds the power. The pause sows confusion. Streets stay clogged. Vulnerable New Yorkers pay the price.
- 2024-06-07 · Vote · Open States · ↑ helps gradeSenate backs S 9752. Mt. Vernon gets green light for up to 20 school speed zones. Law aims to slow cars near kids. Most senators vote yes. A few say no. Streets may change. Danger remains for the young.
- 2024-06-07 · Vote · Open States · ↑ helps gradeSenate backs S 9752. Mt. Vernon gets green light for up to 20 school speed zones. Law aims to slow cars near kids. Most senators vote yes. A few say no. Streets may change. Danger remains for the young.
- 2024-06-07 · Leadership · gothamist.com · ↓ hurts gradeAlbany lawmakers walked away. The MTA’s billion-dollar gap remains. No deal. No new funding. Subway upgrades, electric buses, and station fixes hang in the balance. Riders, not drivers, face the cost. Streets stay clogged. Danger lingers for all outside a car.
- 2024-05-28 · Vote · Open States · ↑ helps gradeSenate backs S 9718. Bill orders safe street design for all. Cyclists, walkers, and riders get new protections. Some senators vote no. The car’s grip loosens, but danger remains.
- 2024-05-16 · Leadership · nypost.com · ↑ helps gradeQueens lawmakers demand more express buses before the $15 congestion toll hits. They say MTA left Queens behind. Riders in transit deserts face long, costly trips. Lawmakers call the exclusion unacceptable. They want fair service before new fees begin.
- 2024-04-18 · Vote · Open States · ↑ helps gradeSalazar votes yes on transportation budget bill with no safety impact.
- 2024-04-18 · Vote · Open States · ↑ helps gradeSalazar votes yes on transportation budget bill with no safety impact.
- 2025-08-07 · Leadership · Streetsblog NYC · ↑ helps gradeA pedestrian was killed on Morgan Avenue — the third in three years. Advocates call for protected bike lanes and mid-block crossings. Officials back the push. The city has not redesigned the street. Danger remains.
- 2025-06-13 · Vote · Open States · ↑ helps gradeSenate passes S 8344. School speed zone rules in New York City get extended. Lawmakers make technical fixes. The bill keeps pressure on drivers near schools. Streets stay a little safer for kids.
- 2025-06-12 · Vote · Open States · ↑ helps gradeSenate backs S 4045. Repeat speeders face forced installation of speed assistance tech. Eleven points or six camera tickets triggers action. Law targets reckless drivers. Streets may get safer for those outside the car.
- 2025-06-12 · Vote · Open States · ↑ helps gradeSenate passes S 8344. School speed zone rules in New York City get extended. Lawmakers make technical fixes. The bill keeps pressure on drivers near schools. Streets stay a little safer for kids.
- 2025-05-27 · Vote · Open States · ↑ helps gradeSenate backs S 8117. Oneida County gets school speed zone cameras. Law sunsets in 2030. Lawmakers act. Streets near schools may slow. Children walk safer. Drivers face new eyes.
- 2025-05-20 · Vote · Open States · ↑ helps gradeS 7955 moved in the Senate. It ties school bus stop‑arm cameras to how tickets get judged. The aim is enforcement around stopped school buses.
- 2025-05-07 · Vote · Open States · ↑ helps gradeSalazar votes yes on transportation budget bill with no safety impact.
- 2025-05-07 · Vote · Open States · ↑ helps gradeSalazar votes yes on transportation budget bill with no safety impact.
- 2026-05-15 · Sponsor · Open States · ↑ helps gradeS 10459 would create a bicycle lane safety program in New York City using photo devices. It targets vehicles that use bike lanes and protected bike lanes. It aims to clear space where cyclists ride.
- 2026-02-19 · Leadership · AMNY · ↑ helps gradeA new NYLPI report says wheelchair riders wait longer for taxis and FHVs. Only 7% of NYC’s huge for-hire fleet is accessible. People get left at the curb, stuck waiting in busy pickup lanes.
- 2026-02-04 · Leadership · Streetsblog Empire State · ↑ helps gradeNYSERDA cut off implementation cash. The city’s first e-bike subsidy pilot froze. Low-income riders lost a planned path to legal, affordable e-bikes.
- 2026-02-04 · Leadership · Streetsblog NYC · ↓ hurts gradeNYSERDA gave planning cash, then cut off the build. Bike New York’s “Ride Clean New York” sits on paper. Riders in transit-poor and low-income areas keep waiting while car traffic keeps the edge.
212 Evergreen Ave., Brooklyn, NY 11221
718-573-1726
State Capitol Room 514, Building 172 State Street, Albany, NY 12247
518-455-2177
Other Geographies See nearby areas
▸ Other Geographies
Brooklyn CB 1 Brooklyn Community Board 1 sits in AD 50, Brooklyn, District 34, Precinct 94, SD 18.
It contains Greenpoint, Williamsburg, South Williamsburg, East Williamsburg.
▸ See also
